
Methodology
Here’s how we calculate walking, cycling and transit times to the nearest of each of 29 kinds of place: where trips start, where they end, how each mode is routed, and why some blocks have no time. Further down are the exact sources and settings of the current release, its known limits and how to cite it. If you’re new to the map, start with Reading the map; for what we count as a grocery store, a clinic or a park, see Amenities.
Calculating travel times
Section titled “Calculating travel times”Travel times are calculated from two kinds of starting point: 2021 census dissemination blocks, and a finer grid of hexagons.
A dissemination block is Statistics Canada’s smallest standard census area. Each block is routed from one representative point. In a city a block is usually one street block, so that point is close to every home in it. In rural areas a block can cover several square kilometres, so a home at the far edge can be many minutes from the block’s point. That is why the map uses hexagons for large blocks.
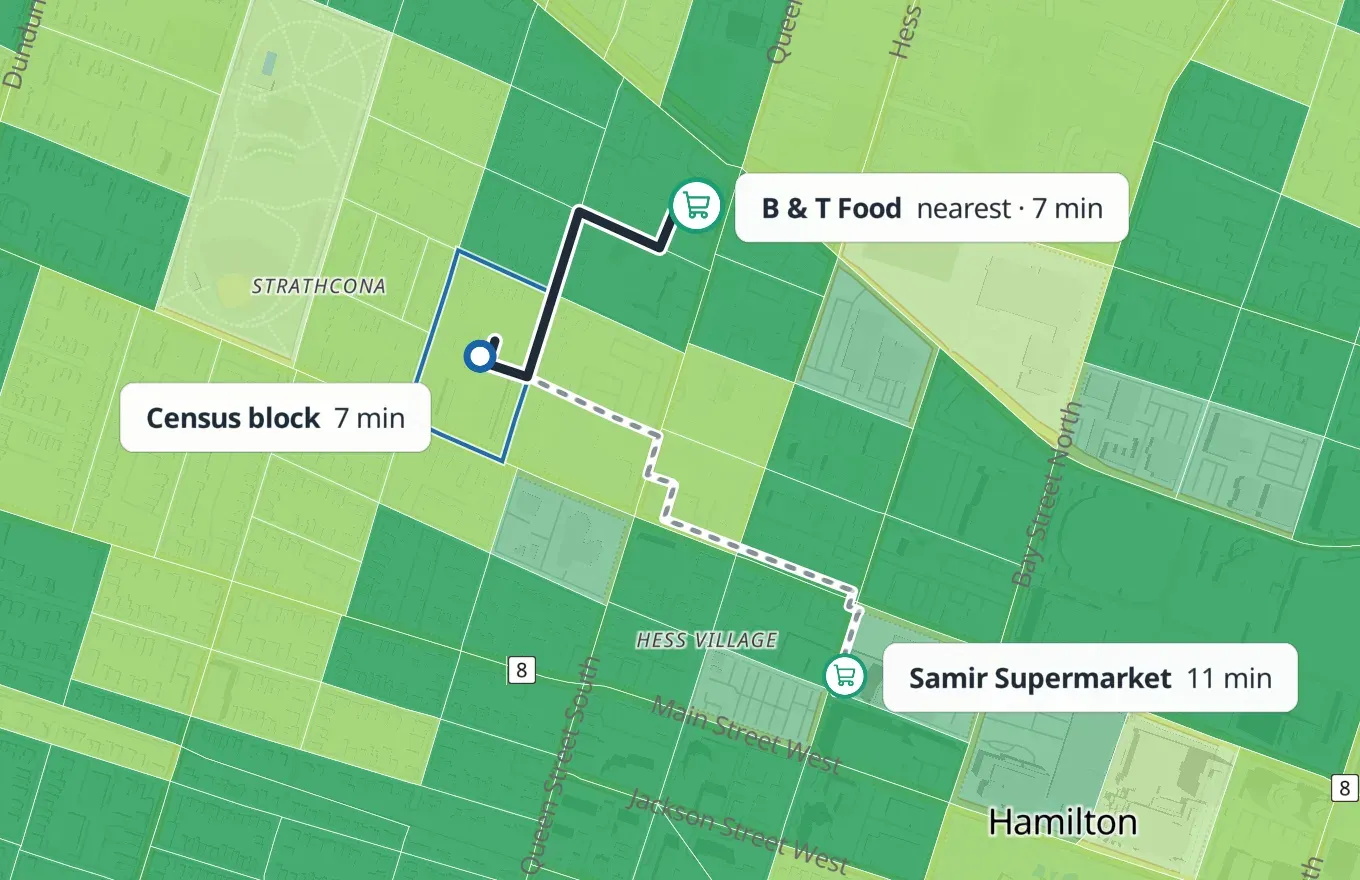
The hexagons come from H3, a global grid, at resolution 10: each cell is about 130 m across and is routed from its centre. Hexagons are routed wherever people live, and in small unpopulated blocks (1 km² or less) that contain a destination, such as a campus or a shopping area.
For each starting point and category, the result is the shortest trip to any destination in that category, up to 60 minutes: on foot along the pedestrian network, by bicycle along the cycling network, or by public transit from a stop reached on foot or by bicycle.
Blocks and hexagons on the map
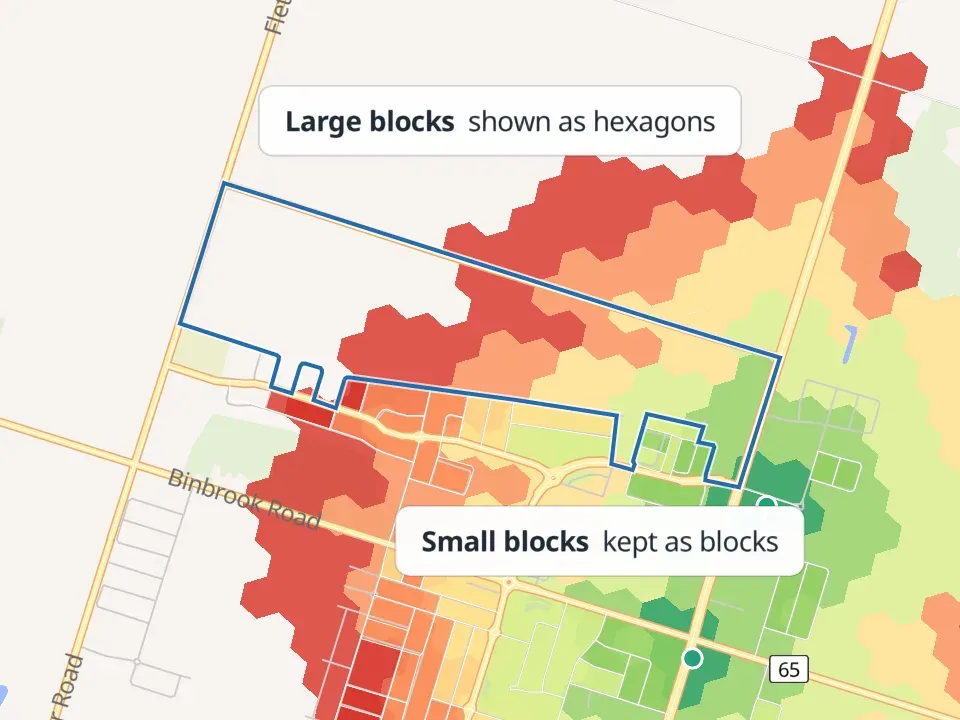
Section titled “Blocks and hexagons on the map”The map shows census blocks where they are small – 0.1 km² or less, about 300 m by 300 m – and hexagons everywhere else. Hexagons draw once the map is zoomed in to a neighbourhood; further out it shows blocks alone, which read better at that scale. In cities most of the map is blocks; in towns and rural areas it is mostly hexagons. Large unpopulated blocks have no hexagons and are left blank.
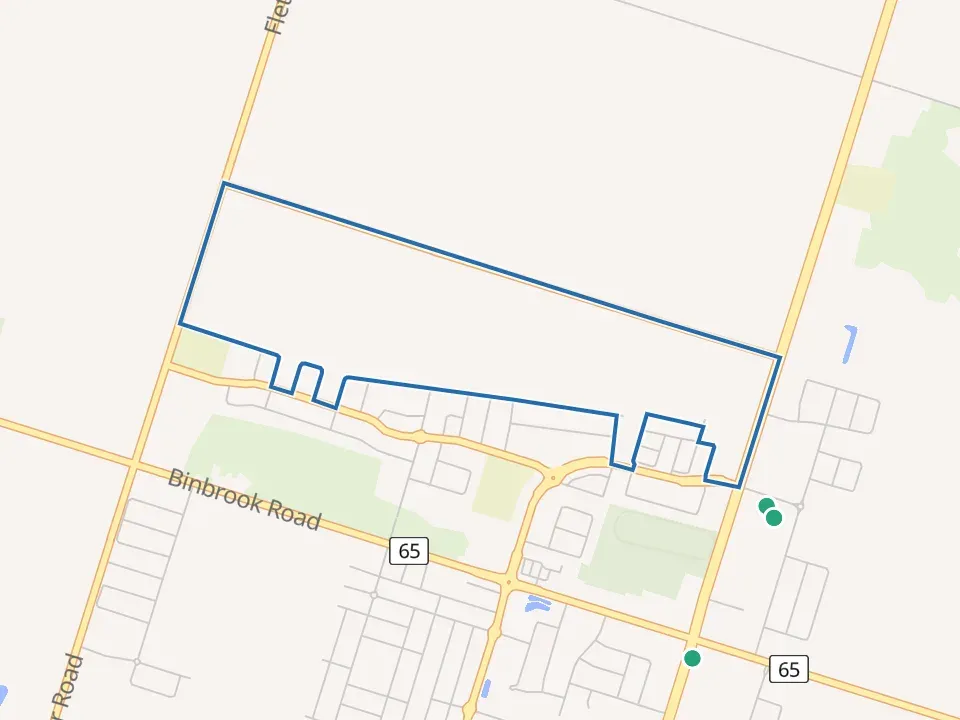
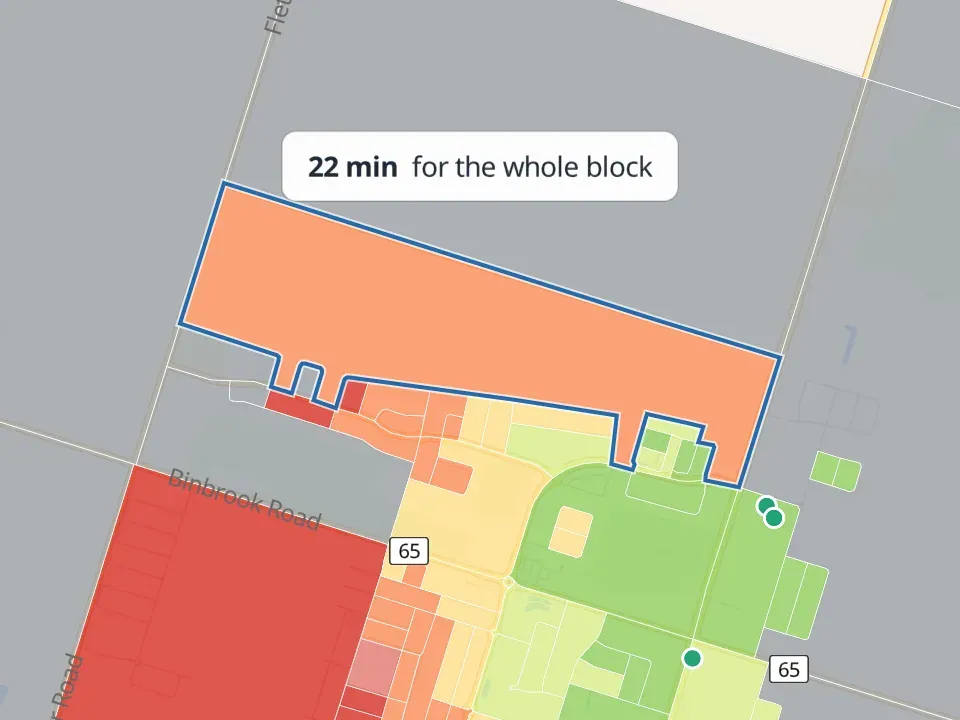
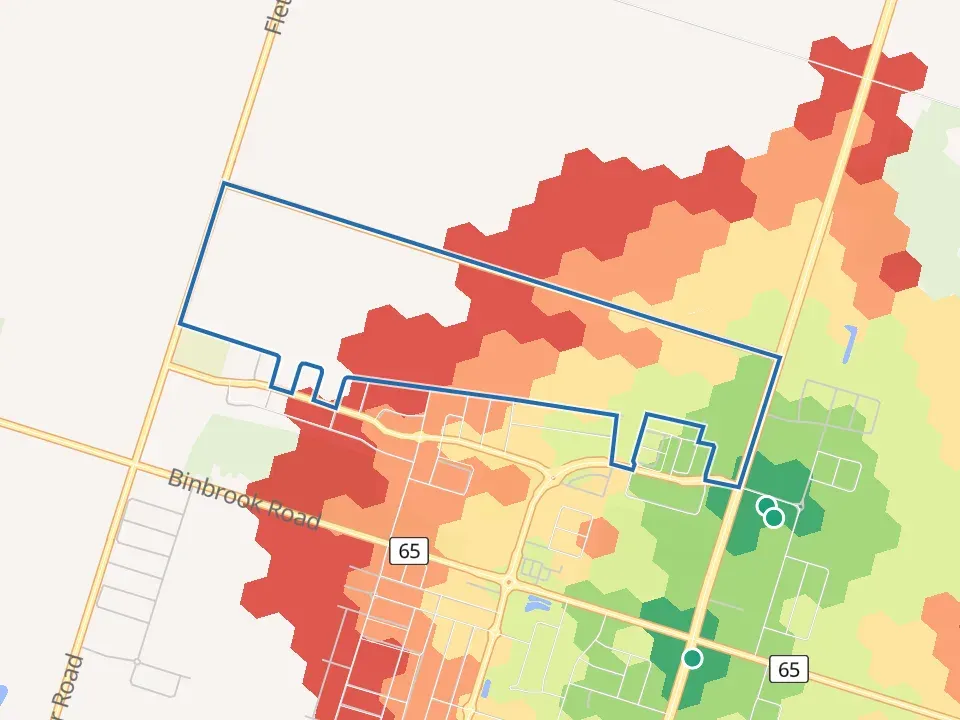
The gap between a block’s time and its hexagons’ can be wide. A 5.7 km² block on Highway 5 West in rural Hamilton has 113 residents. From its representative point, the walk to the nearest grocery store is 19 minutes. Its residents are counted in the 64 hexagons that hold its 120 mapped homes, and from there the median resident’s walk is 50 minutes.
 a
The areaThe outlined block and the grocery stores near it.
 b
BlocksOne value for the whole block: 22 minutes.
 c
HexagonsInside the block: 6 to 45 minutes.
 d
Hybrid (what the map shows)Hexagons, with small blocks kept.
The Streets view colours each street by the hexagon it passes through. Streets are cut at hexagon edges, and each piece takes that hexagon’s times. Streets in a hexagon with no result stay uncoloured.
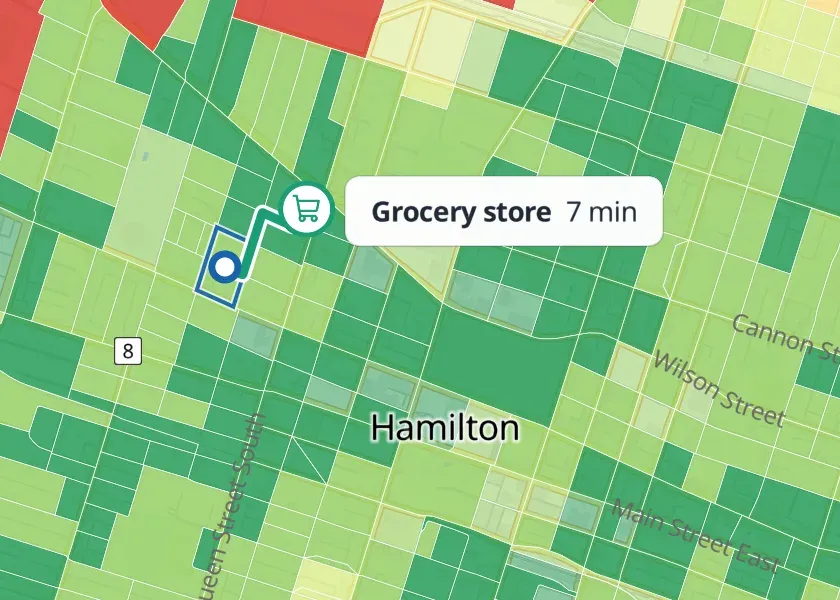
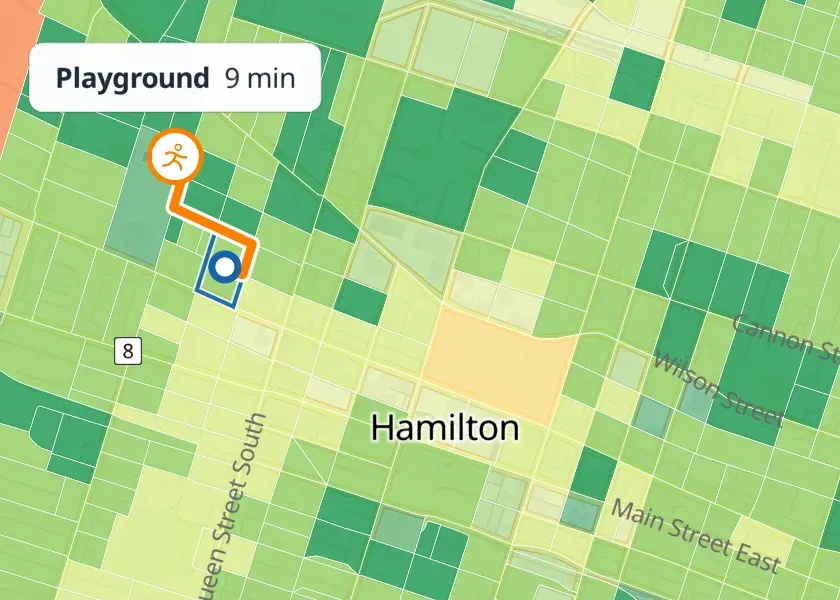
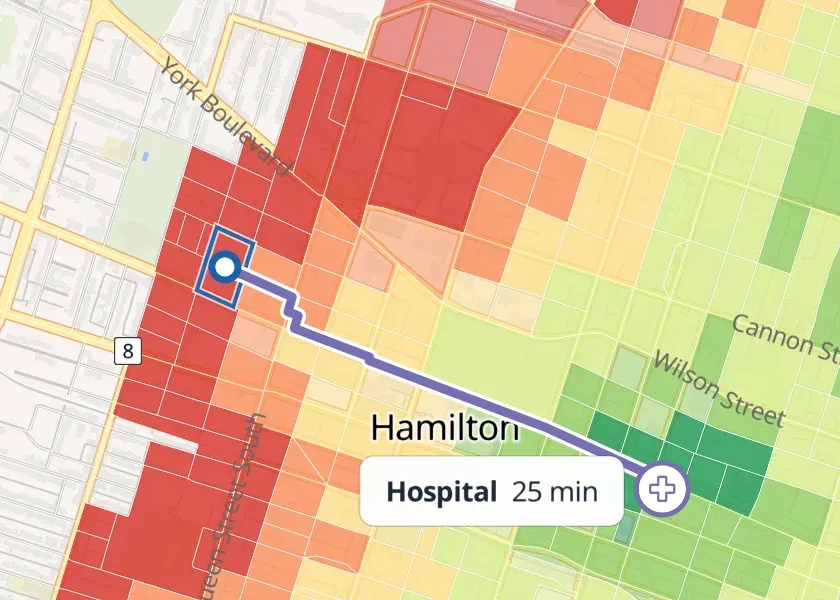
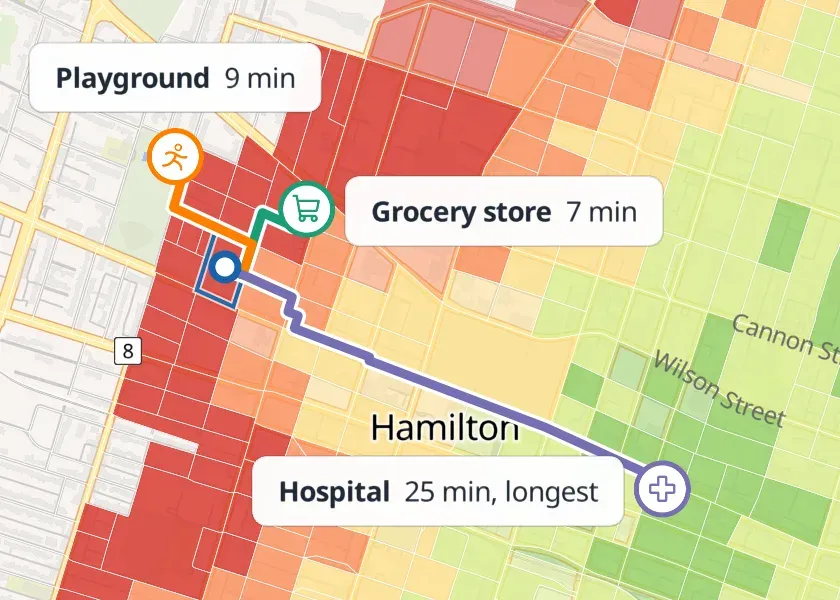
When several categories are selected, the map shows the longest of their nearest times. This is the travel time needed to reach each selected category on its own, not a single trip that visits all of them.
 a
Grocery store selectedB & T Food, 7 min
 b
Playground selectedNearest playground, 9 min
 c
Hospital selectedSt Joseph's satellite facility, 25 min
 d
All three selected25 min, set by the hospital
Sources
Section titled “Sources”| Source | Used for | Licence |
|---|---|---|
| Statistics Canada, 2021 Census | Block boundaries, representative points, population | Statistics Canada Open Licence |
| OpenStreetMap | Streets and paths; destinations | ODbL 1.0 |
| Overture Maps Foundation, Places | Destinations | Set per contributor: CDLA-Permissive-2.0, Apache 2.0 or CC0 1.0 |
| Natural Resources Canada, MRDEM-30 | Elevation | Open Government Licence – Canada |
| Statistics Canada, Open Database of Healthcare Facilities | Checking, and adding to, hospitals, clinics, nursing homes and pharmacies | Open Government Licence – Canada |
| Statistics Canada, Open Database of Educational Facilities | Confirming schools from ambiguous Overture categories and setting their levels | Open Government Licence – Canada |
| Transit operators, GTFS timetables | Transit and bike + transit times | Each operator’s terms (Transit timetables) |
The version of each source in the current release is under Release details, and the credit it asks for is on Sources and licences.
Combining OpenStreetMap and Overture
Section titled “Combining OpenStreetMap and Overture”Many places appear in both OpenStreetMap and Overture. We combine them with our own adaptation of OpenPOIs, Nat Henry’s open-source toolkit for matching place records across datasets. It pairs records by name, category and distance (up to 200 m) and matches each record with at most one from the other source.
A second pass then removes duplicates that remain. Two records are treated as the same place only when:
- they have the same name and category, are within 30 m of each other, and no other similar place is nearby; or
- they have the same category, are within 100 m, have similar names, and share both a phone number and an address.
Two Overture records must also share a phone number or address. Schools are left out of the second pass. Pairs that don’t meet these tests stay as separate destinations.
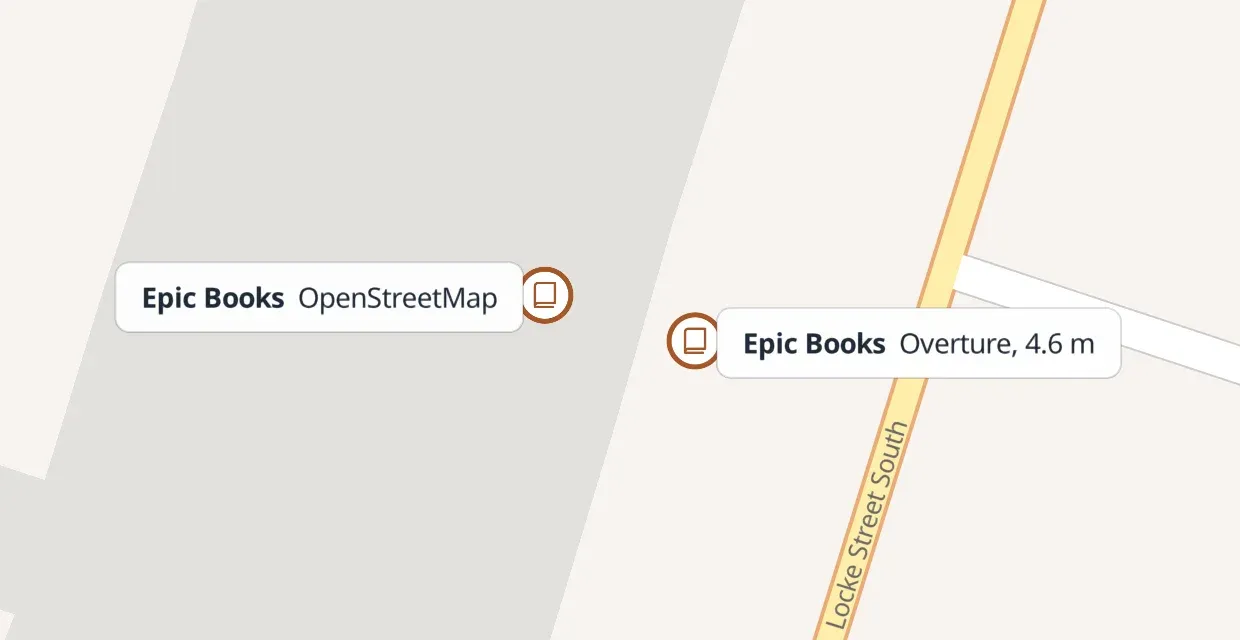 a
Merged: Epic Books, HamiltonOne record in each source, 4.6 m apart, same address (226 Locke St S) and phone number.
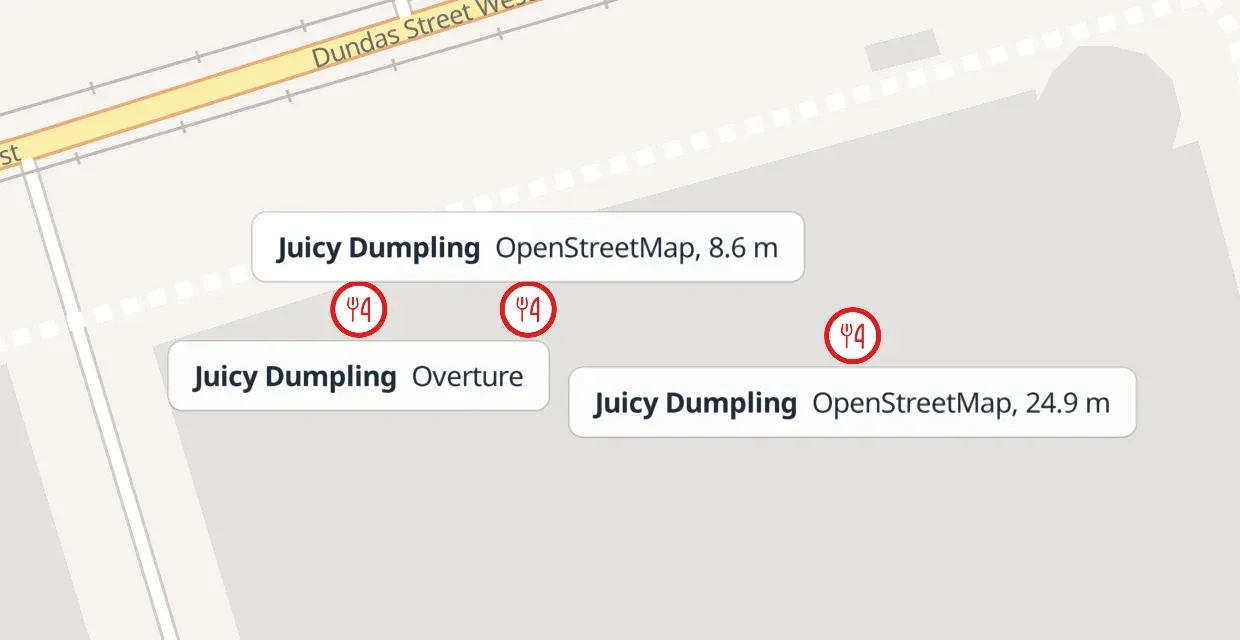 b
Held for review: Juicy Dumpling, TorontoTwo OpenStreetMap records, 8.6 m and 24.9 m from one Overture record.
How to read this figure
Two decisions from the current release, at the positions each source gives. Each marker is one source record, labelled with its source.
A duplicate that slips through doesn’t change walking times: the nearest grocery store is the same distance away whether it is listed once or twice. It does add one to the destination counts.
We then sort each place into one of the map’s kinds of amenity.
Walking network
Section titled “Walking network”R5, open-source routing software, builds a pedestrian network from the streets and paths in OpenStreetMap, through r5py, its Python interface. The network for each census division is routed separately, clipped from its province’s or territory’s extract to the bounding box of its blocks plus 3 km, so walks that cross into a neighbouring census division are still found. A walk or ride across a provincial or territorial boundary is not: each province is routed with its own streets and destinations (see Known limits).
A block’s destinations are the places within 3 km of the bounding box of its census subdivision’s blocks. A 60-minute walk can reach up to about 4.3 km downhill, so a walk of 55 to 60 minutes across that edge can be missed. A census subdivision with no destination of any kind in that area has no walking time for any of its blocks.
Hexagons, and every cycling time, are routed in larger regions of H3 cells. In the current data each region’s network and destinations extend about 6.6 km past its edge. That covers a 60-minute walk, but a 60-minute ride can cover up to 14.4 km, so a cycling time can be too long, or missing, within about 8 km of a region’s edge.
Starting points and destinations are connected (“snapped”) to the nearest walkable street or path. A point that can’t be connected gets no result. Not yet on the map: a block whose point can’t be connected will start from the nearest point on its own boundary that can, within 2 km of the block’s point.
Parks and playgrounds are often mapped as areas with a single label point that can be far from any entrance. A census block gets zero walking time for that category (and for the park size classes) when it overlaps or touches a mapped park, dog park or playground area. The rule applies to blocks only: hexagons, and every cycling time, are routed to the park’s access points, so a hexagon inside a large park shows the walk to its nearest access point.
Trips from blocks outside a park end at one of its access points. Access points are the park’s mapped entrances and gates, and the places where streets and paths cross its edge. A park with neither is reached at its edge where a path or street runs close to it, or failing that at its label point. A park under 0.5 ha has one access point; larger parks have up to 12, spread around the edge.
Walking speed and hills
Section titled “Walking speed and hills”On flat ground the model walks at 3.6 km/h, R5’s default: 60 m a minute, so 15 minutes covers about 900 m of street.
We keep this value so that every walking time on the map uses the same pace everywhere in Canada, including walks to and from transit stops. That pace is slower than the 5 km/h often quoted for an adult walking briskly, so the map’s times can look long. The map colours a block grey when the walk from it to a selected place takes over 30 minutes. At 3.6 km/h, a 2 km walk along the streets takes about 33 minutes, so the block it starts from turns grey; at 5 km/h the same walk takes 24 minutes. If you walk faster than 3.6 km/h, you cover more ground in 33 minutes than the map shows. If you walk more slowly, open the No car view and set its walking pace.
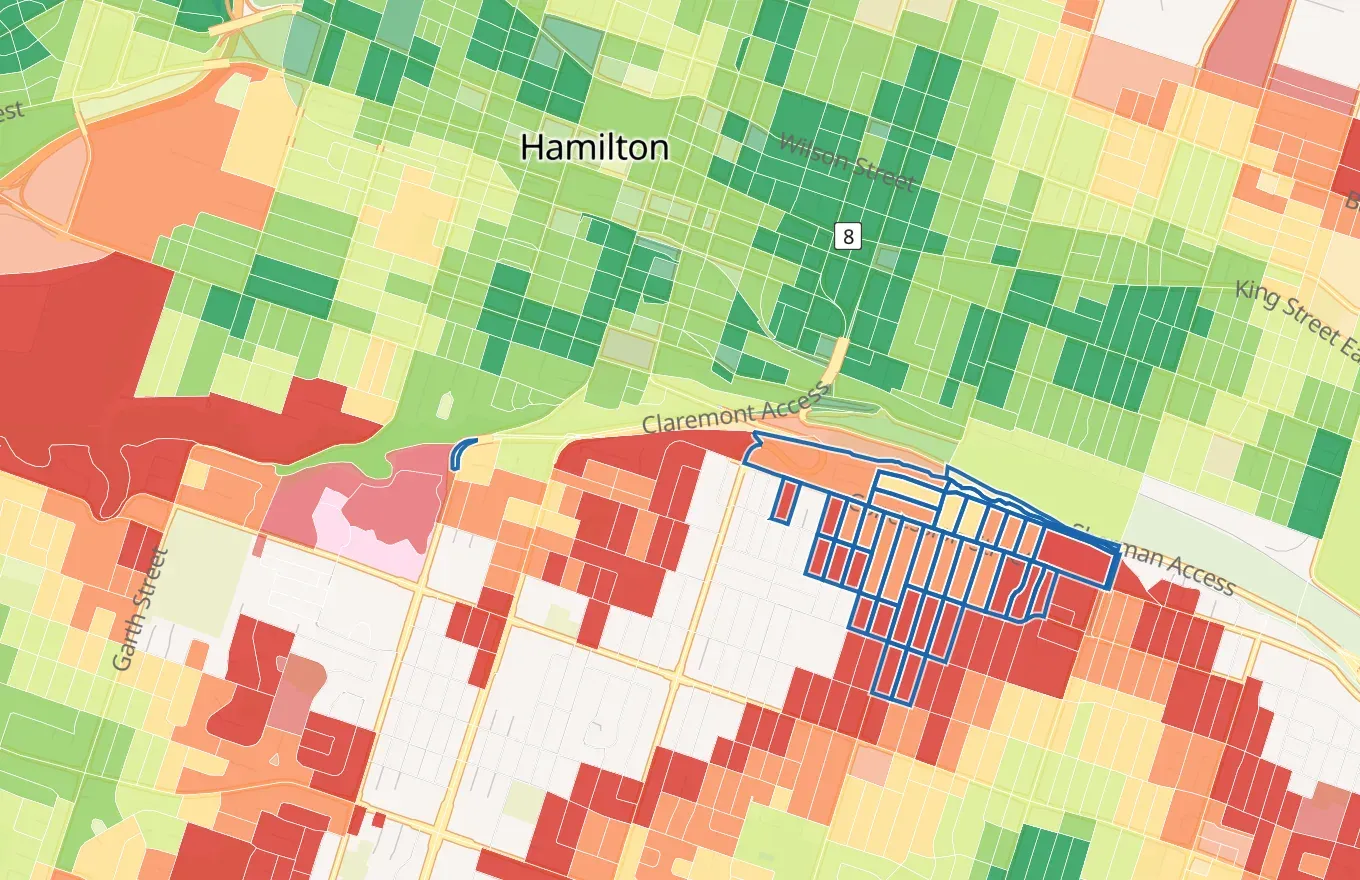
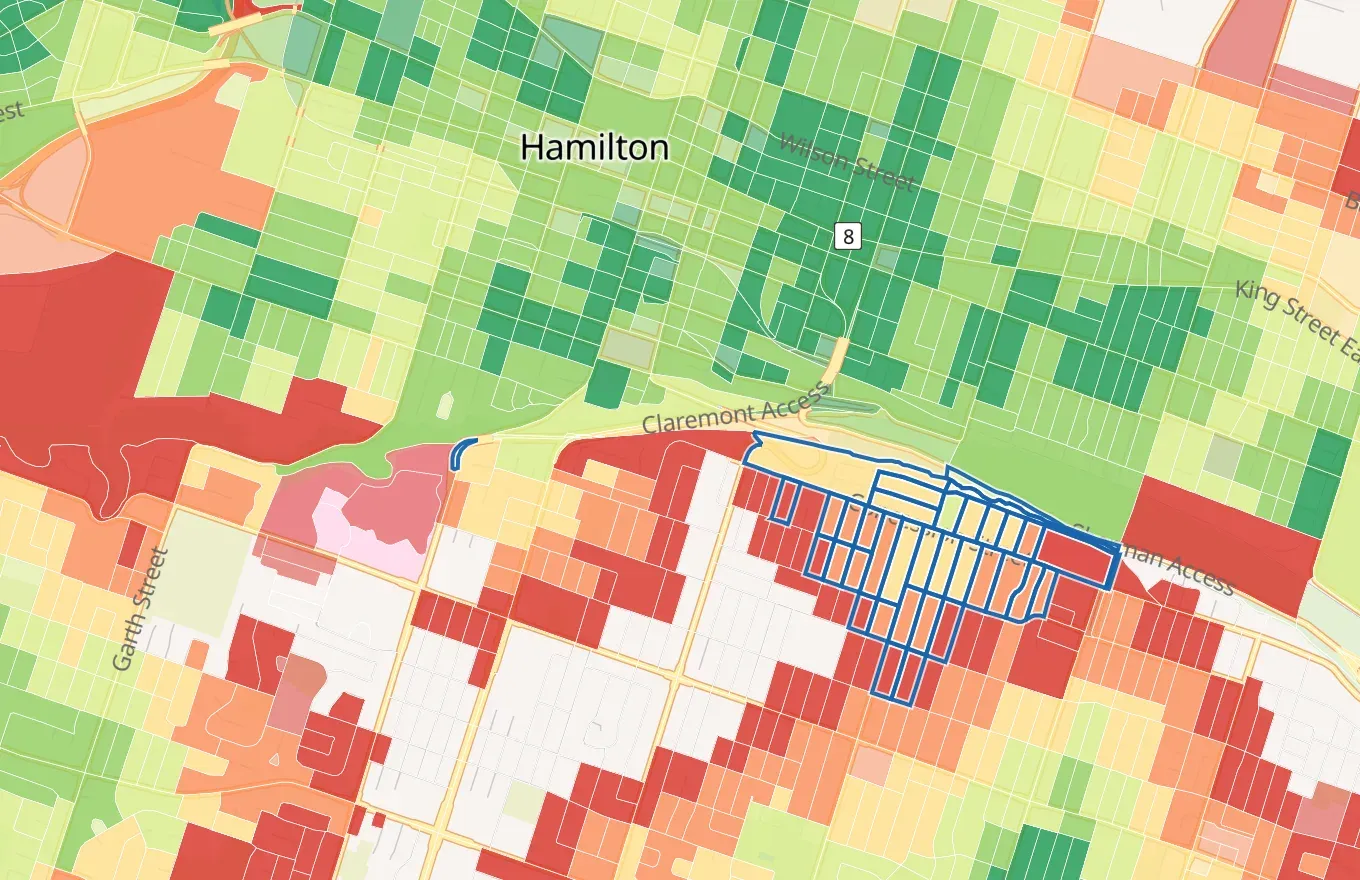
Speed changes with slope according to Tobler’s hiking function, using elevation from MRDEM-30, Natural Resources Canada’s 30 m national elevation model. Gentle descents are slightly faster than flat ground; climbs and steep descents are slower. A walk to a destination can therefore take a different time from the return trip. We measure the trip to the destination. The elevation model gives one height for each cell of about 30 to 55 m across, so a stretch of street shorter than a cell takes its slope from the centres of the cells at its two ends. No street counts as steeper than 40%, slightly steeper than the steepest streets on record (35 to 37%). In the current data, adding hills makes walks from the map’s hexagons in Hamilton 0.7 minutes longer on average, and changes 98% of them by 4 minutes or less. The largest changes are on routes up and down the escarpment.
Everyone is modelled at the same speed. The model does not adjust for age, mobility, strollers, weather or winter conditions.
Cycling
Section titled “Cycling”Cycling times use the same destinations and elevation model as walking. On flat ground the model cycles at 12 km/h: 200 m a minute, so 15 minutes covers about 3 km of street.
We build the cycling network with the same elevation model and R5’s Tobler slope setting as walking, so slope changes cycling time by the same proportion as walking time: at most 1.2 times faster on a gentle descent, and slower on climbs and steep descents. This is an approximation: Tobler’s function describes walking, not cycling. We measured climbs of 100 to 200 m up Hamilton’s escarpment and North Vancouver’s Lonsdale Avenue. On them, the ride takes longer than on flat ground by 5% to 22%. The same rule also slows steep descents, making the ride back down 4% to 14% longer where a real rider would usually go faster, so cycling times on steep downhill routes are conservative.
Cycling is routed from the hexagons only. At 12 km/h a hexagon takes about 20 seconds to cross, so a block takes the cycling time of the hexagon containing its representative point. Where that hexagon has no result, the block takes the median of the routed hexagons within two rings around it; with none, the block has no result. A cycling time is at most the walking time to the same kind of place.
Routes keep to streets and paths with a level of traffic stress of 3 or less on the four-level scale. Level 4 covers streets that most riders find stressful, such as busy multi-lane roads without a bike lane. R5 estimates each street’s level from its OpenStreetMap tags. Where a route has to use a level 4 street, the rider walks the bicycle along it at walking speed.
The model does not account for parking or locking a bicycle, bike-share availability, cycling infrastructure quality beyond the traffic-stress level, or the delay at traffic signals.
Transit
Section titled “Transit”Transit times are calculated from the timetables that transit operators publish in the GTFS format, so you’ll only find transit times where an operator publishes one (transit coverage). We credit every operator whose timetable we use (sources and licences).
Each release routes one service day of each type: a Wednesday, a Saturday and a Sunday. Results are published for four departure periods:
| Period | Service day | Departures |
|---|---|---|
| Weekday peak | Wednesday | 07:00–09:00 |
| Weekday night | Wednesday | 22:00–01:00 |
| Saturday midday | Saturday | 12:00–14:00 |
| Sunday midday | Sunday | 12:00–14:00 |
The weekday night period includes trips that the timetable lists after midnight on the Wednesday’s service; early trips on the following day are not included.
Within each period, 24 departure times are sampled, one from each equal slice of the window: one every 5 minutes on average in a two-hour period. Every starting point uses the same departure times. For each departure, the trip is the fastest combination of:
- up to 30 minutes on foot (walk + transit) or by bicycle (bike + transit) to a stop;
- waiting, riding and transferring, with up to 8 vehicles in one trip;
- a walk from the last stop to the destination.
The whole trip, including the first wait, is limited to 60 minutes. In bike + transit, the bicycle is left at the first stop and is not carried on board.
Where walking or cycling directly is faster than any transit trip for a departure, that departure takes the direct time. A starting point with no stop within 30 minutes takes its walking or cycling time for every departure.
The 24 departures give a spread of trip times. The map shows either the median (Typical) or the 90th percentile (Worst case), the time that only one departure in ten exceeds. Both are interpolated linearly between the sorted departures (the usual spreadsheet method), and the median is shown only when at least 13 of the 24 departures reach the destination within the hour. The median reflects a trip at an ordinary moment; the 90th percentile reflects a trip that has just missed an infrequent service.
Each stop is routed once for every minute of the period, and starting points join the results of the stops they can reach. A trip joined this way boards at the first whole minute after the rider reaches the stop, so it can be up to a minute slower than a search from the starting point itself, and is never faster.
Transit coverage
Section titled “Transit coverage”Walking and cycling times are calculated everywhere; transit times only where an operator publishes a timetable we can use. Three things leave an area without transit times:
- No published feed. We start the list of feeds from Statistics Canada’s inventory of public transit feeds. An operator that publishes no timetable, or one the inventory doesn’t know, is missing; its area has walking and cycling times only. Nunavut has no feed at all.
- No service on the sampled days. A timetable that had expired, or that runs only in another season, is loaded but adds no trips.
- A feed that couldn’t be used, such as a failed download or an on-demand service whose feed isn’t a timetable.
In the current data, 64% of Canadians live within a 10-minute walk of a stop with a departure in any of the four periods: 23.8 million of the 37.0 million counted in 2021. By province and territory the share runs from 75% in British Columbia to 23% in Newfoundland and Labrador, and 0% in Nunavut. The walk to the stop is routed with the same network and settings as the walking times.
Thresholds and shares
Section titled “Thresholds and shares”Walking and cycling times are whole minutes, rounded down: a walk of 15 minutes 59 seconds reads 15. So “within 15 minutes” means a routed trip of less than 16 minutes. Transit times are kept to the nearest tenth of a minute and compared without rounding.
A share is a proportion of the 2021 residents of the inhabited census blocks in an area: for example, the residents of a city within a 15-minute walk of a grocery store. A block of 0.1 km² or less counts all its residents at the block’s own time. A larger block counts them in the hexagons the map draws there, not at its point. Its population is shared out between the hexagons that hold its buildings, in proportion to each hexagon’s buildings, and each share takes its hexagon’s times. The buildings are OpenStreetMap’s, from the same download as the streets, without the kinds that are not homes, such as garages, barns, shops and churches. A large block with no mapped building is shared out between hexagons spread evenly across it, one for about every 0.7 km², or between all the hexagons centred inside a smaller block. Residents with no time stay in the total and never count as within.
The map’s default Hybrid shading draws the same hexagons, so the shares and the map agree. Blocks shading still colours each large block by the time from its representative point.
To check a share yourself, download the current data’s block
archive (SHA-256
e8fbf6714cdaac864f31486f24ef484dc2a66f0389ff461fa4d8cb1ff5d01105), read each block’s grocery
value at the archive’s highest zoom, and join the blocks’ 2021 Census populations (Statistics
Canada notice). Large blocks need the published
fragments, with checksums in their manifest:
- fragments.parquet: one row per large block
and hexagon, with the block (
block_id), the H3 cell (cell), the block’s residents counted there (population), whether they were placed by buildings or by area (source) and the buildings counted (dwellings). - cells-walk.parquet, cells-bike.parquet and cells-transit.parquet: each of those hexagons’ minutes to every kind of place on foot, by bike and by transit at the weekday morning peak; 999 means nothing within the hour.
- block-fragments.json: the counts, and the checksum of every input.
In Mississauga (census subdivision 3521005), add up the population of the blocks with a grocery
value of 15 or less, leaving out the blocks listed in fragments.parquet. For those, add the
population of each row whose cell has a grocery value of 15 or less in cells-walk.parquet.
Divide by the population of all the city’s inhabited blocks: that gives
67.8%.
Release details
Section titled “Release details”Each release is dated. We record its source snapshots, classification rules, software versions and a checksum for every output file, so you can trace any result back to its inputs. Blocks, hexagons, street colours and amenity dots on the site always come from the same release.
The current data is from October 8, 2026, the date of its block archive; its transit timetables were downloaded on 10 October and sampled on 14, 17 and 18 October 2026. To check that a download matches ours, compare it with the checksums of the published files; the transit timetables used are listed in the source notices.
| Item | Value |
|---|---|
| Starting points | 2021 census dissemination blocks (384,284 inhabited blocks, totalling 36,991,971 residents) and H3 resolution-10 hexagons |
| Kinds of place | 34 routed: the 29 kinds on the map, plus three park sizes and two school levels |
| Routing engine | R5 7.5.1 through r5py 1.1.6 |
| Time limit | 60 minutes for every mode; walking and cycling times rounded down to whole minutes, transit times rounded to the nearest tenth of a minute |
| Walking speed | 3.6 km/h on flat ground, adjusted for slope with Tobler’s hiking function |
| Cycling speed | 12 km/h on flat ground, with R5’s Tobler slope setting; streets up to traffic stress level 3 |
| Street network | Provincial and territorial extracts, clipped to each census division’s blocks plus 3 km, and to each H3 routing region plus about 6.6 km for hexagons and cycling |
| Destinations | Within 3 km of each census subdivision’s blocks, from the same province or territory |
| Transit days | Wednesday 14, Saturday 17 and Sunday 18 October 2026 |
| Source | Version |
|---|---|
| Statistics Canada, 2021 Census blocks and population | 2021 Census |
| OpenStreetMap streets, paths and places | Geofabrik provincial and territorial extracts of 25 August 2026 |
| Overture Maps Places | Release 2026-09-23.0 |
| Statistics Canada, Open Database of Healthcare Facilities | v2.0 (24 September 2026) |
| Statistics Canada, Open Database of Educational Facilities | v3.0.1 |
| Natural Resources Canada, MRDEM-30 elevation | 30 m model |
| Transit timetables (GTFS) | 128 feeds from 85 operators, most downloaded 10 October 2026 (17 kept from an earlier download) |
Known limits
Section titled “Known limits”- Travel times are modelled, not observed. Comparisons between areas describe this model and its data, not how people there travel.
- Blank blocks mix “nothing within an hour” with “not computed”: the data doesn’t tell the two apart. A block or hexagon is not computed when its point can’t be connected to the street network. It is also not computed in a few far-northern areas, where no network could be built. In the current data, 53,321 of the 384,284 inhabited blocks have no walking time from their representative point to any kind of place; 1.56 million people (4.2%) live in them. 1.45 million people (3.9%) have no walking time to any kind of place when counted where they live, with large blocks shared out between their hexagons.
- Provincial and territorial boundaries. Trips are routed within one province or territory, so a place across the boundary is never the nearest. The places most affected are Ottawa and Gatineau, Lloydminster, Campbellton, Edmundston, Amherst and Flin Flon: within about 3.6 km of the boundary on foot, and about 14 km for hexagons and cycling.
- Edges of routing areas. A walk can be missed when its destination is more than 3 km beyond a census subdivision’s blocks and the trip takes 55 to 60 minutes. A cycling time can be too long or missing within about 8 km of the edge of an H3 routing region (Walking network).
- Remote cycling times. Routing skips a hexagon from which no 60-minute walk could reach a destination of any kind, so that hexagon has no cycling time either, even where a bicycle would reach a destination within the hour.
- One point per block or hexagon. Hexagons keep this error small on the map and in the shares, which count a large block’s residents in the hexagons where its buildings are. A building mapped in OpenStreetMap is counted as one home, however many dwellings it holds, so in a large block with both houses and apartment buildings the houses weigh more than they should.
- Campuses. Universities, colleges and other large sites are reached at one point inside the site, so the time to a campus can be longer than the walk to its nearest entrance. Parks are reached at their entrances and edges.
- Transit follows published timetables for one sampled day of each type. Delays, cancellations, crowding, and seasonal, holiday and school-term changes are not modelled, and an operator without a published timetable is missing (Transit coverage).
- Everyone walks and cycles at the same speed. Age, mobility, strollers, weather and winter are not modelled.
- Mapping completeness. A place missing from both OpenStreetMap and Overture is missing here.
- Census vintage. Block boundaries and population come from the 2021 Census; streets and places are more recent.
- Not modelled: opening hours, temporary closures, unrecorded access restrictions, construction, sidewalk condition, crossings, snow clearing and step-free access.
How to cite
Section titled “How to cite”See Citing à portée for the citation and the credits to keep with results.
The papers and datasets we rely on are listed in References.