
Map views
Here’s each way you can colour the map, what each view measures and how we calculate it. Once you’re signed in, you choose a view from the card at the top of the sidebar. Minutes, Can-ALE and StatCan SAM are part of plus, free with sign-in; those marked pro need the pro plan.
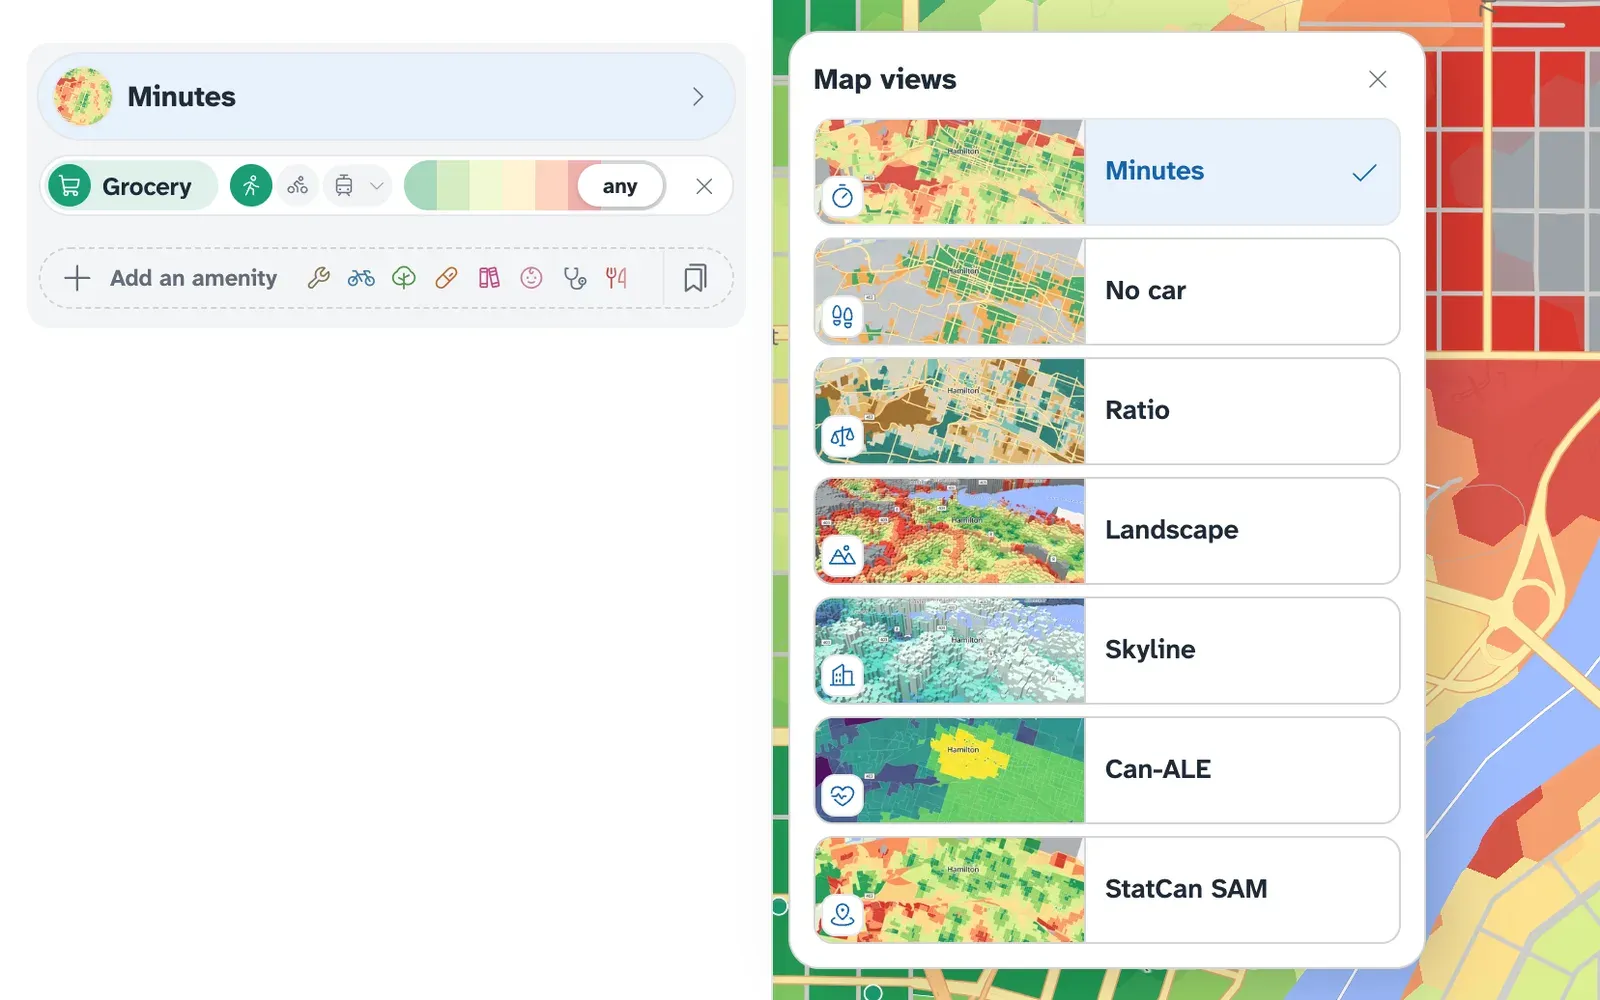
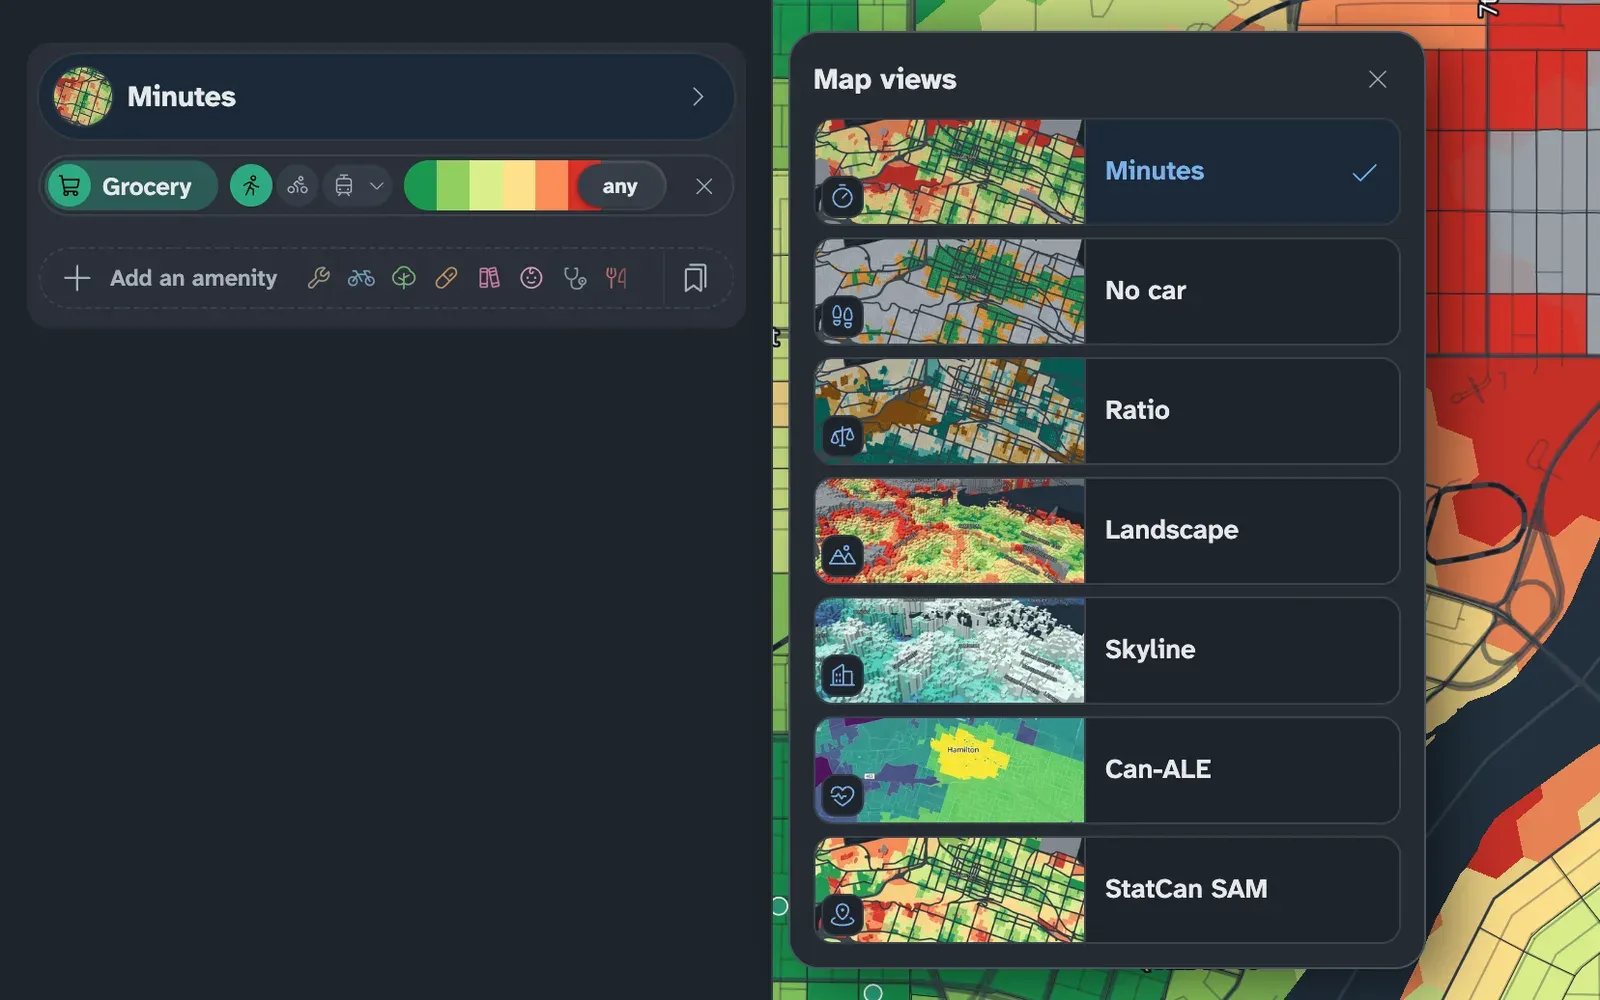
Minutes
Section titled “Minutes”The default view: each census block (or hexagon, where blocks are large) is coloured by the travel time to the nearest of the selected kinds of place, as described in Reading the map. With several selected, it shows the longest of those times.
Signed in, each amenity row has its own travel mode and an optional time limit plus · free with sign-in. A block is then coloured only where every row is within its limit.
No car
Section titled “No car”No car asks whether someone who no longer drives can still reach their everyday errands. It starts with a grocery store, a pharmacy and a clinic, each within a 15-minute walk. That is a starting point: add or remove kinds of place, or change any row’s mode or limit, to match the person you have in mind.
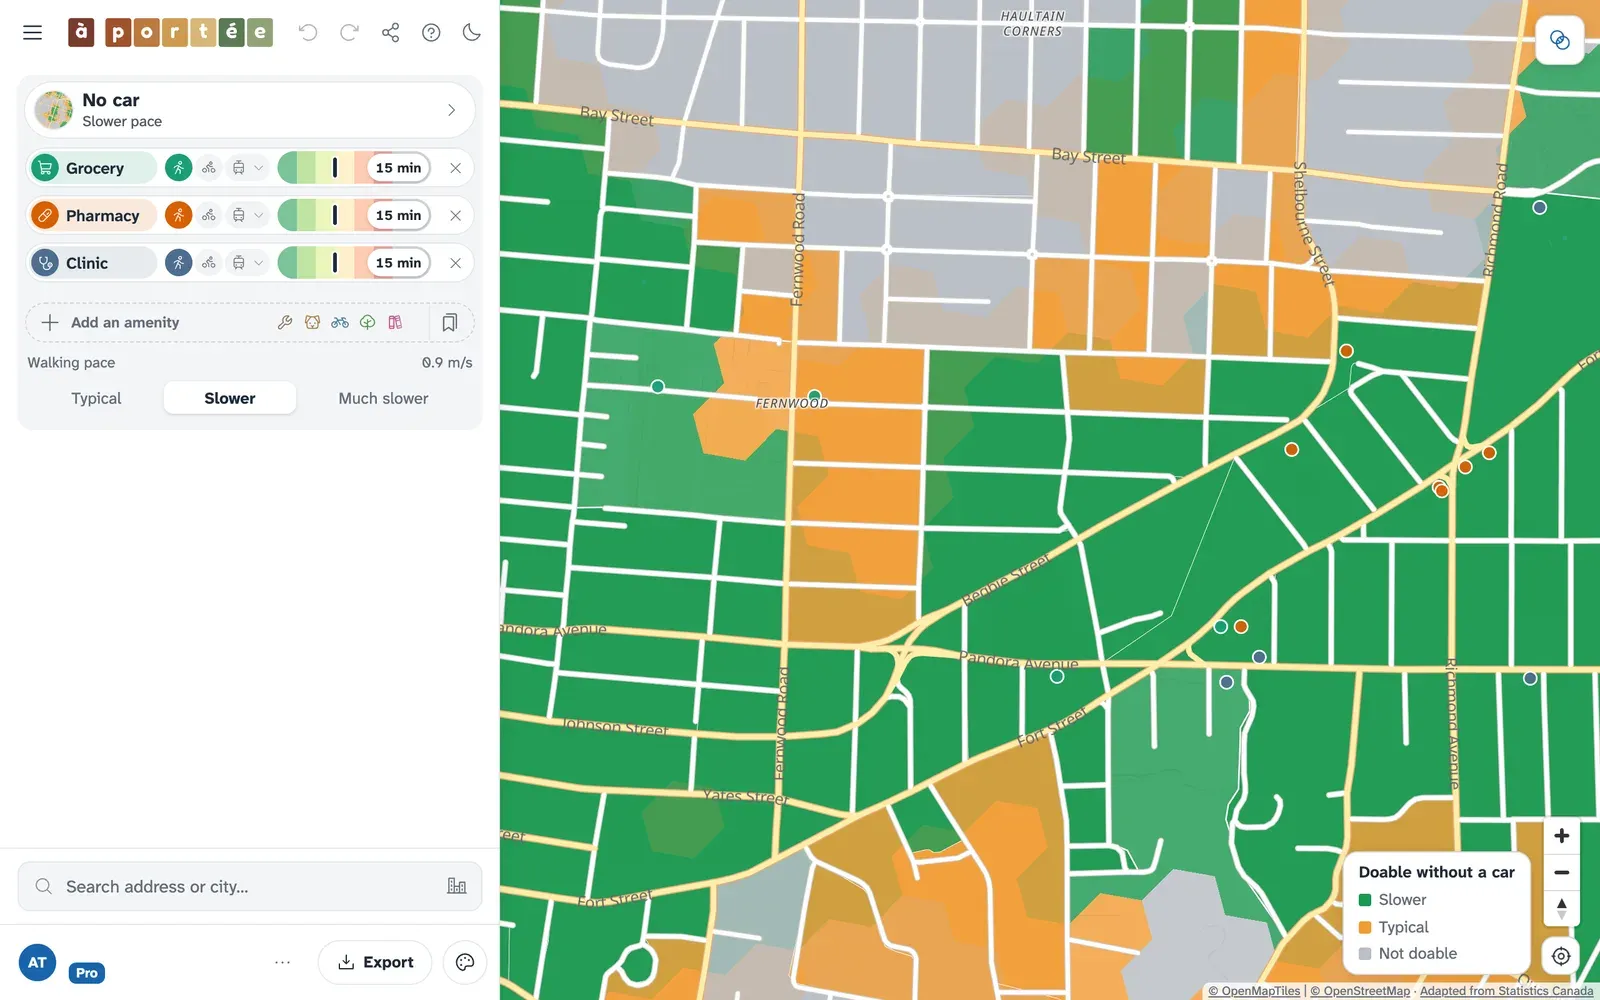
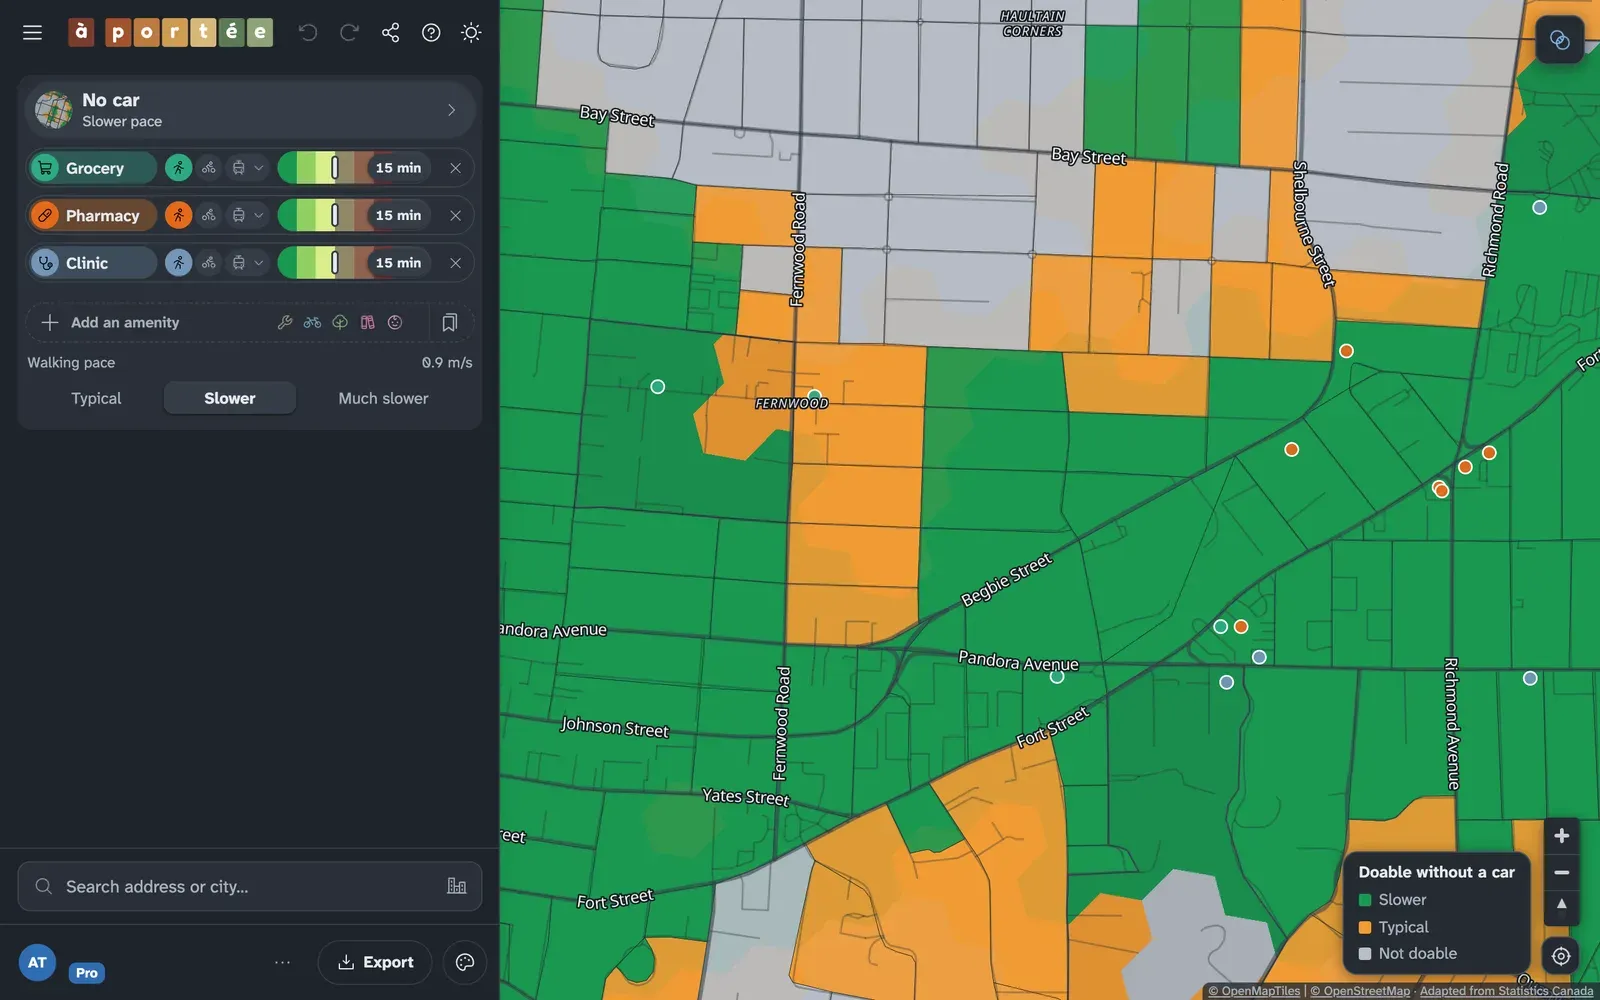
The map colours each block at the chosen walking pace:
- Green: every row is within its limit at that pace.
- Orange: every row is within its limit only at the typical pace.
- Grey: at least one row is beyond its limit even at the typical pace.
Walking pace
Section titled “Walking pace”The Walking pace control has three settings:
- Typical: 1 metre a second (3.6 km/h), the pace every other time on the map uses.
- Slower: 0.9 metres a second. US traffic signals are timed for slower pedestrians at 0.91 metres a second, and Swiss adults aged 80 and over preferred 0.94 (Eggenberger et al., 2017).
- Much slower: 0.8 metres a second, the average normal pace of older women (Asher et al., 2012).
At a slower pace every walk takes proportionally longer: a 10-minute walk takes 12.5 minutes at 0.8. Hills are already part of each walk’s time, so they slow down by the same proportion. The slower pace applies differently by mode: walking rows are adjusted, a transit row is adjusted as a whole (to approximate its walks to and from stops), and cycling rows stay as they are.
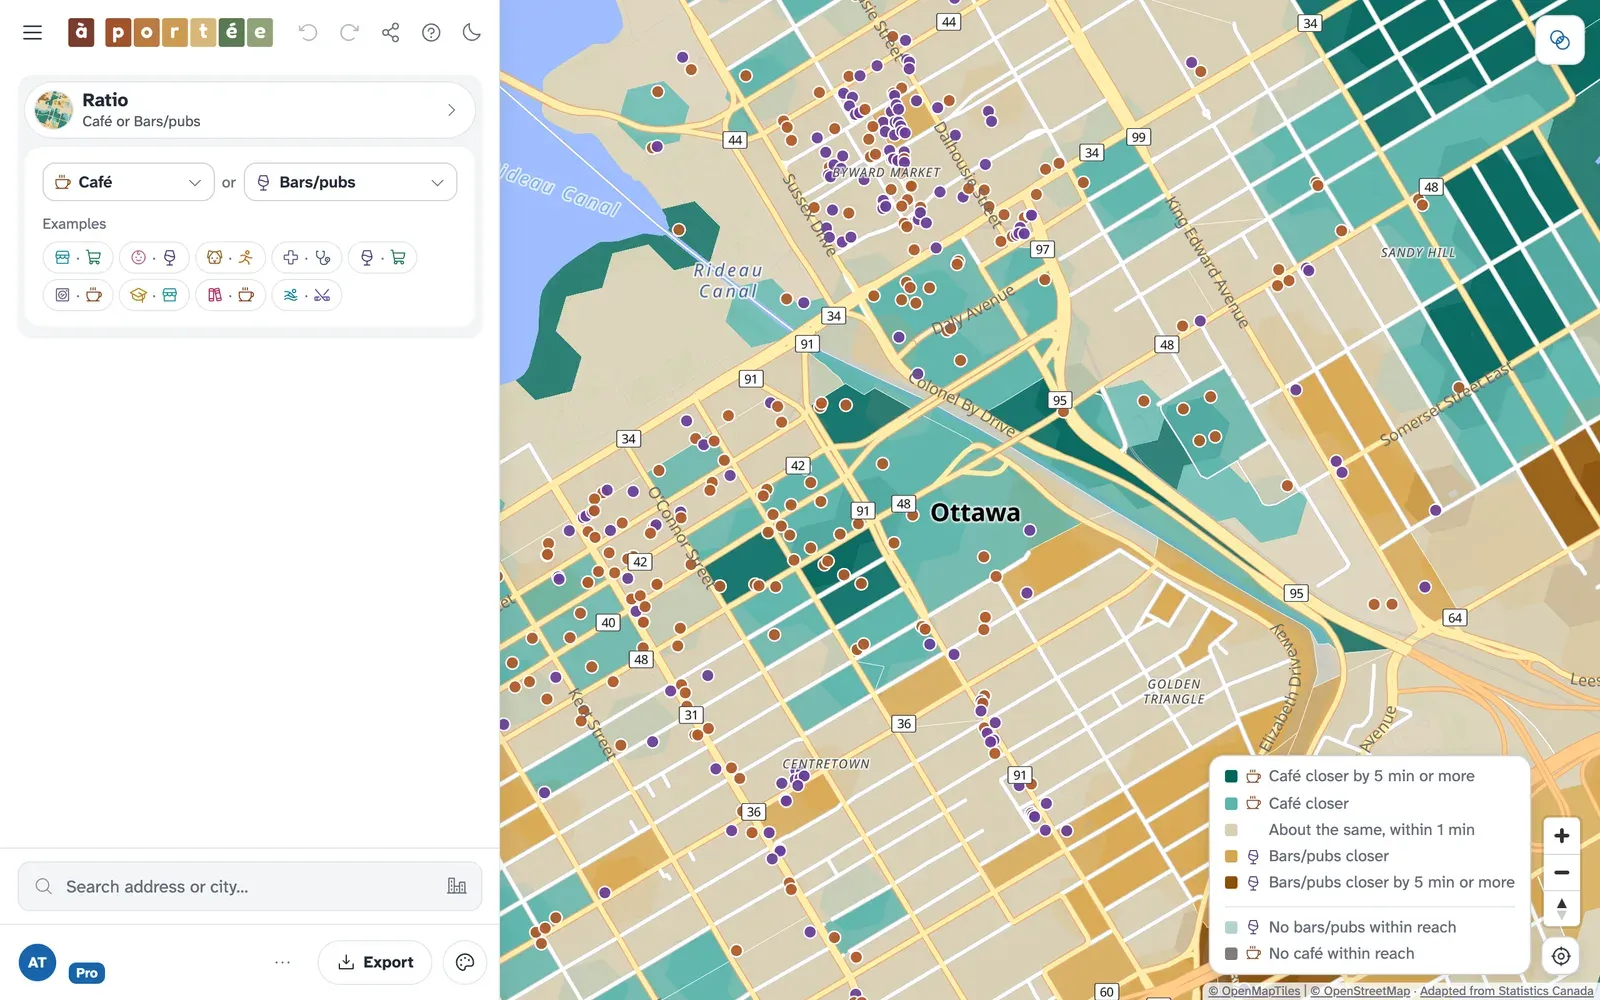
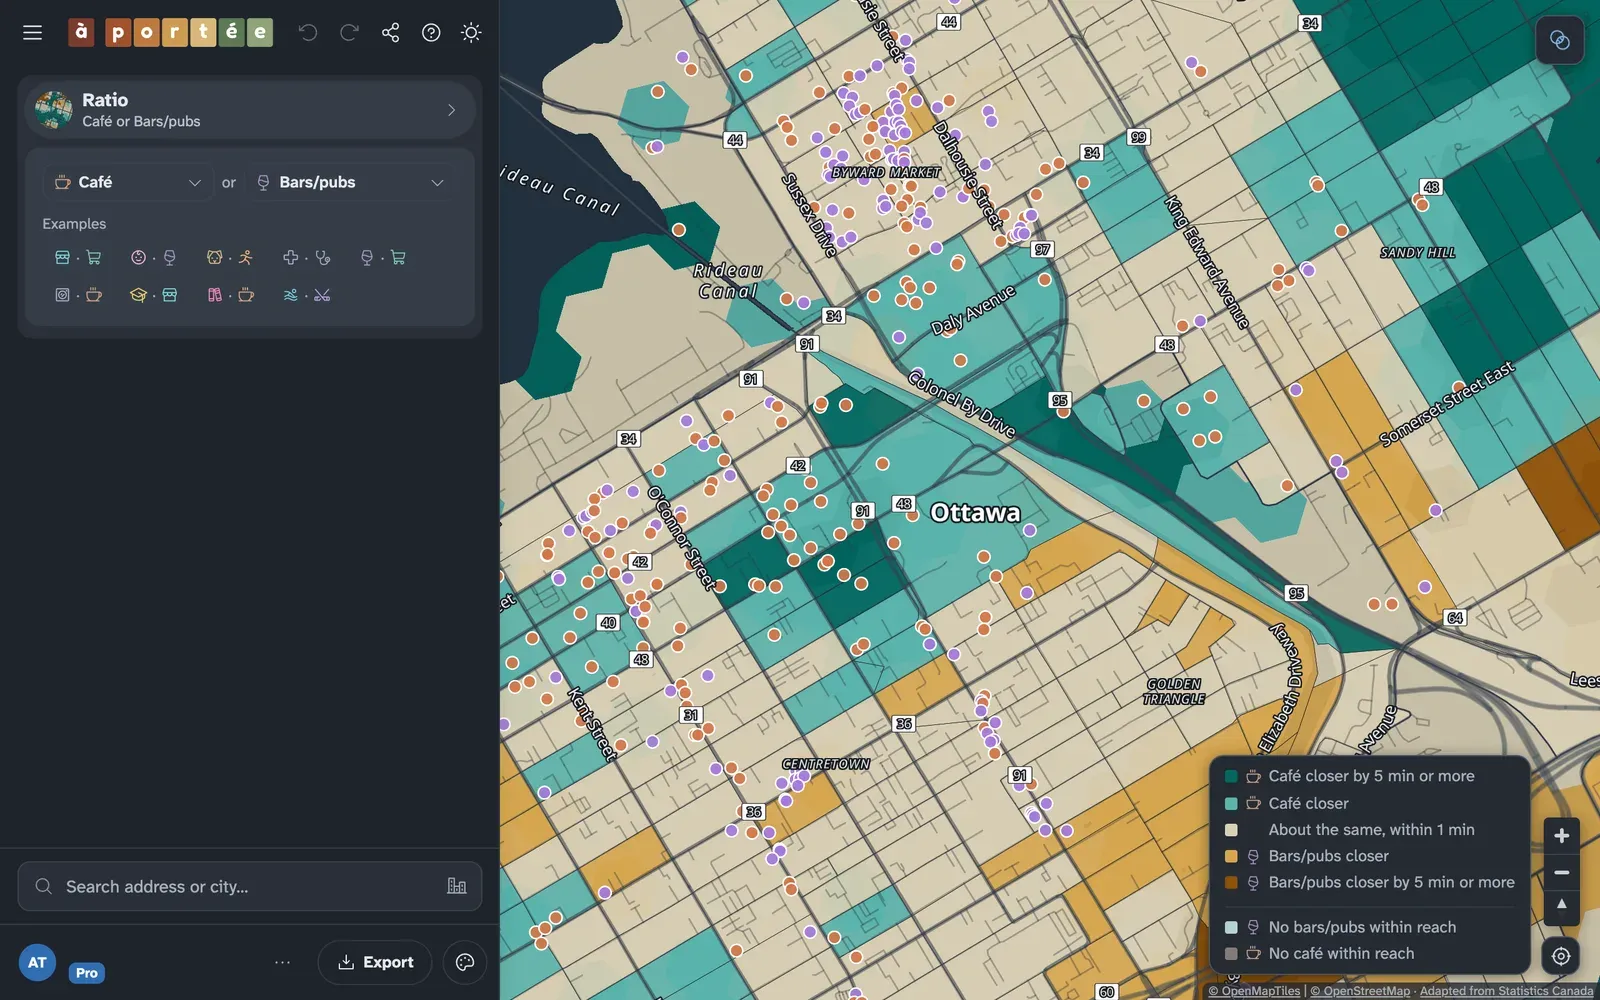
proRatio compares two kinds of place, for example cafés and bars. For each block, we compare the nearest café with the nearest bar on foot and colour the block by how much closer the first is than the second: teal where the first is closer, brown where the second is, and neutral where they are within 2 minutes of each other. Either counts as much closer once the gap reaches 5 minutes. Where only one can be reached, the block takes a grey tinted toward that one; where neither can, the block is left uncoloured.
Can-ALE
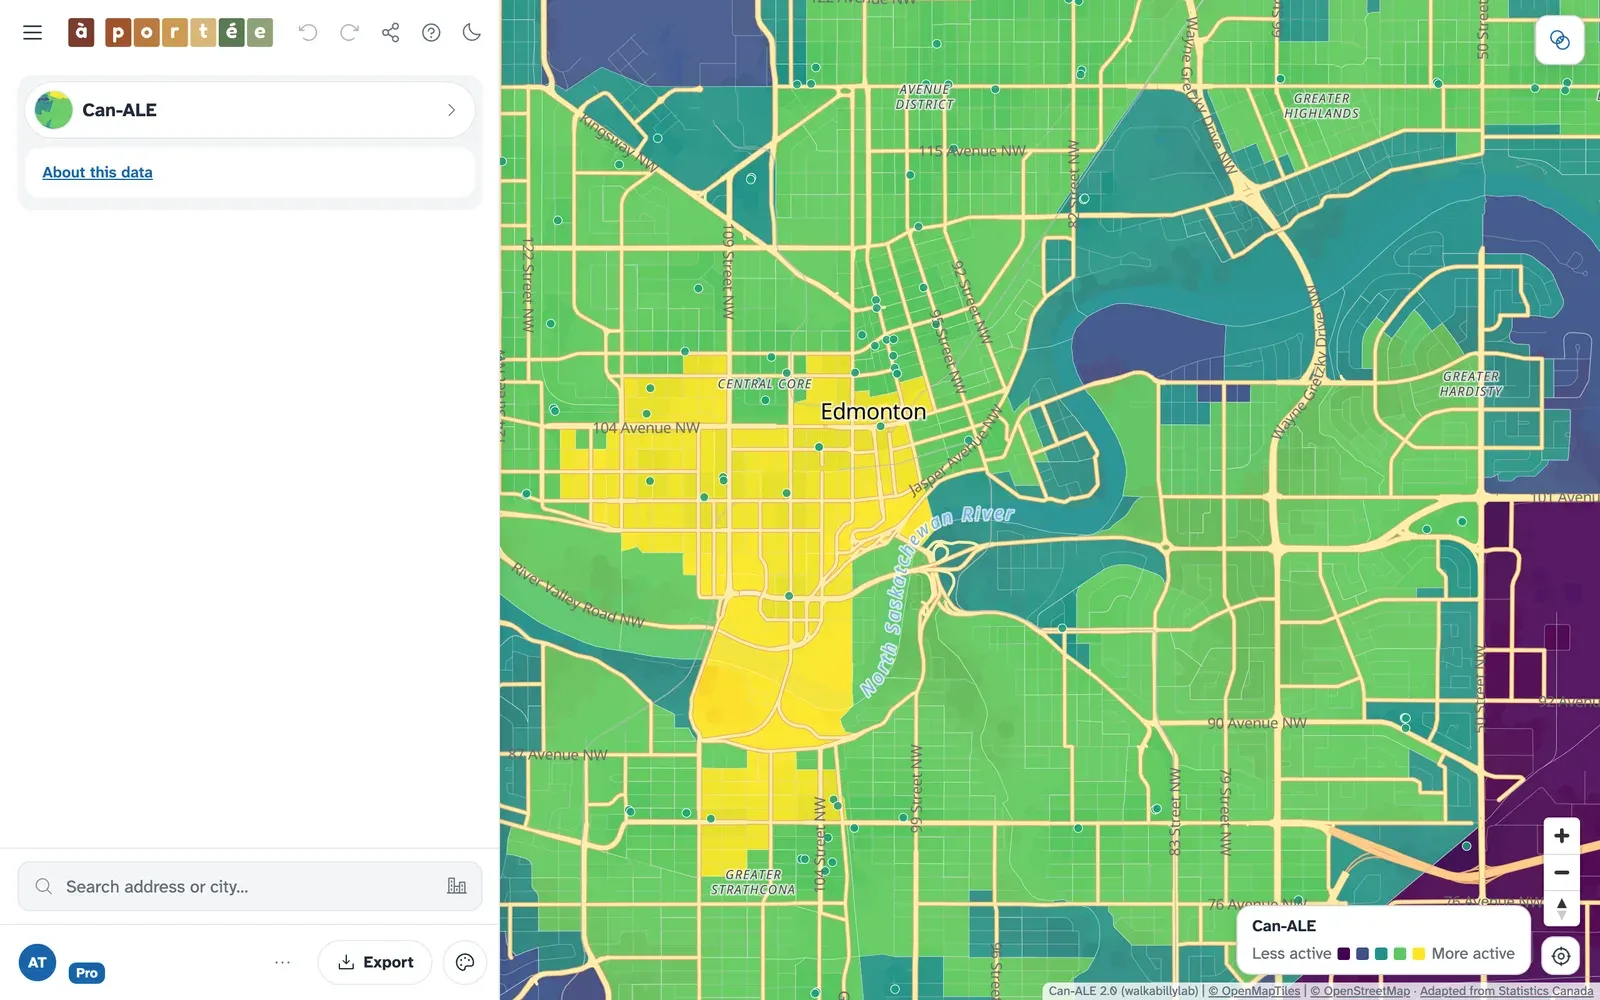
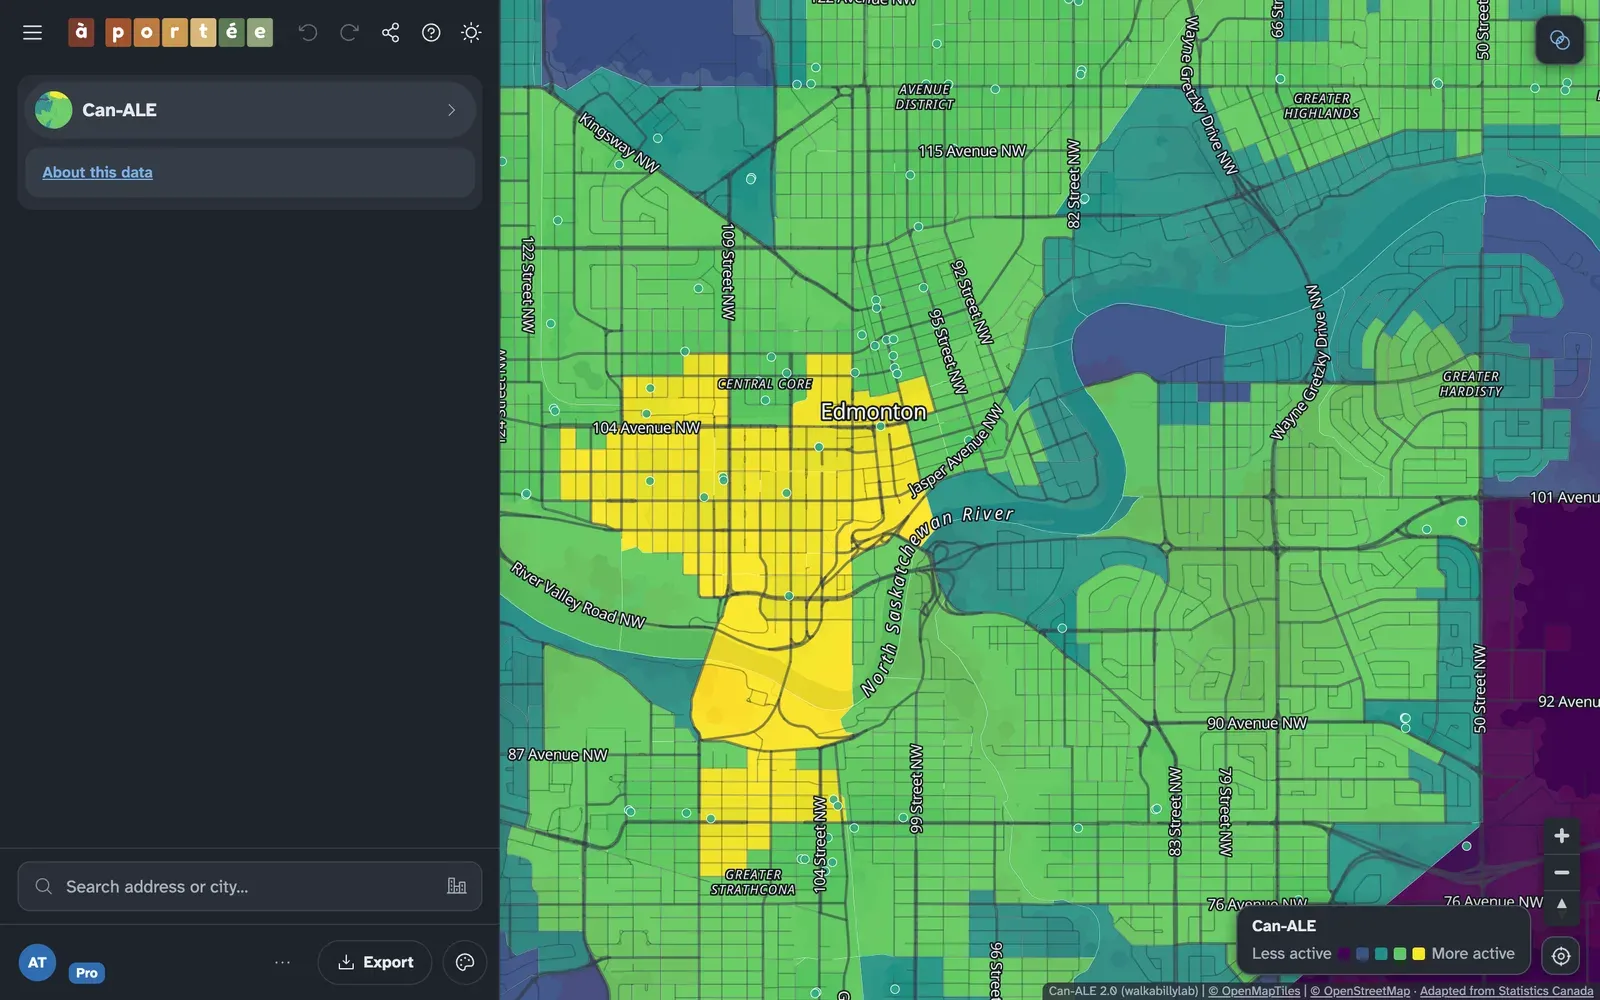
Section titled “Can-ALE”Can-ALE rates each dissemination area from 1 to 5 by how well its built form supports walking, from dwelling density, intersection density and points of interest within 1 km of the area’s population-weighted centre. It is the Canadian Active Living Environments database, shown here in its 2021 edition (Herrmann et al., 2019; Fuller et al., 2026). It describes the shape of a neighbourhood, so it has its own colours and legend. See Can-ALE for the data.
StatCan SAM
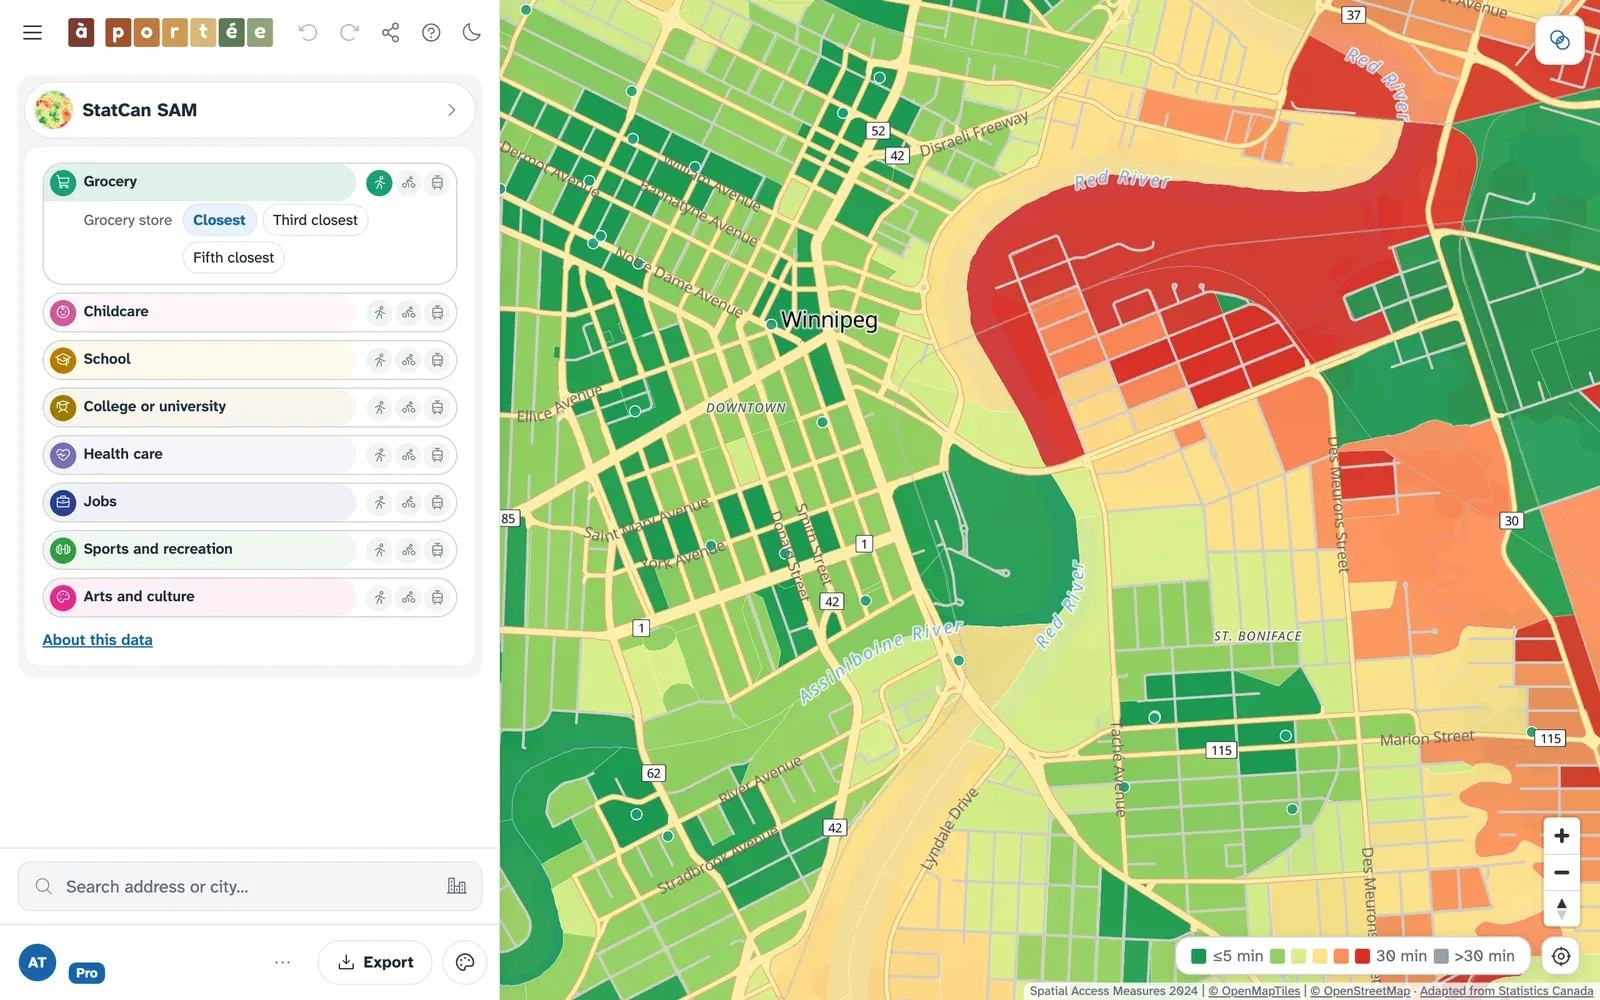
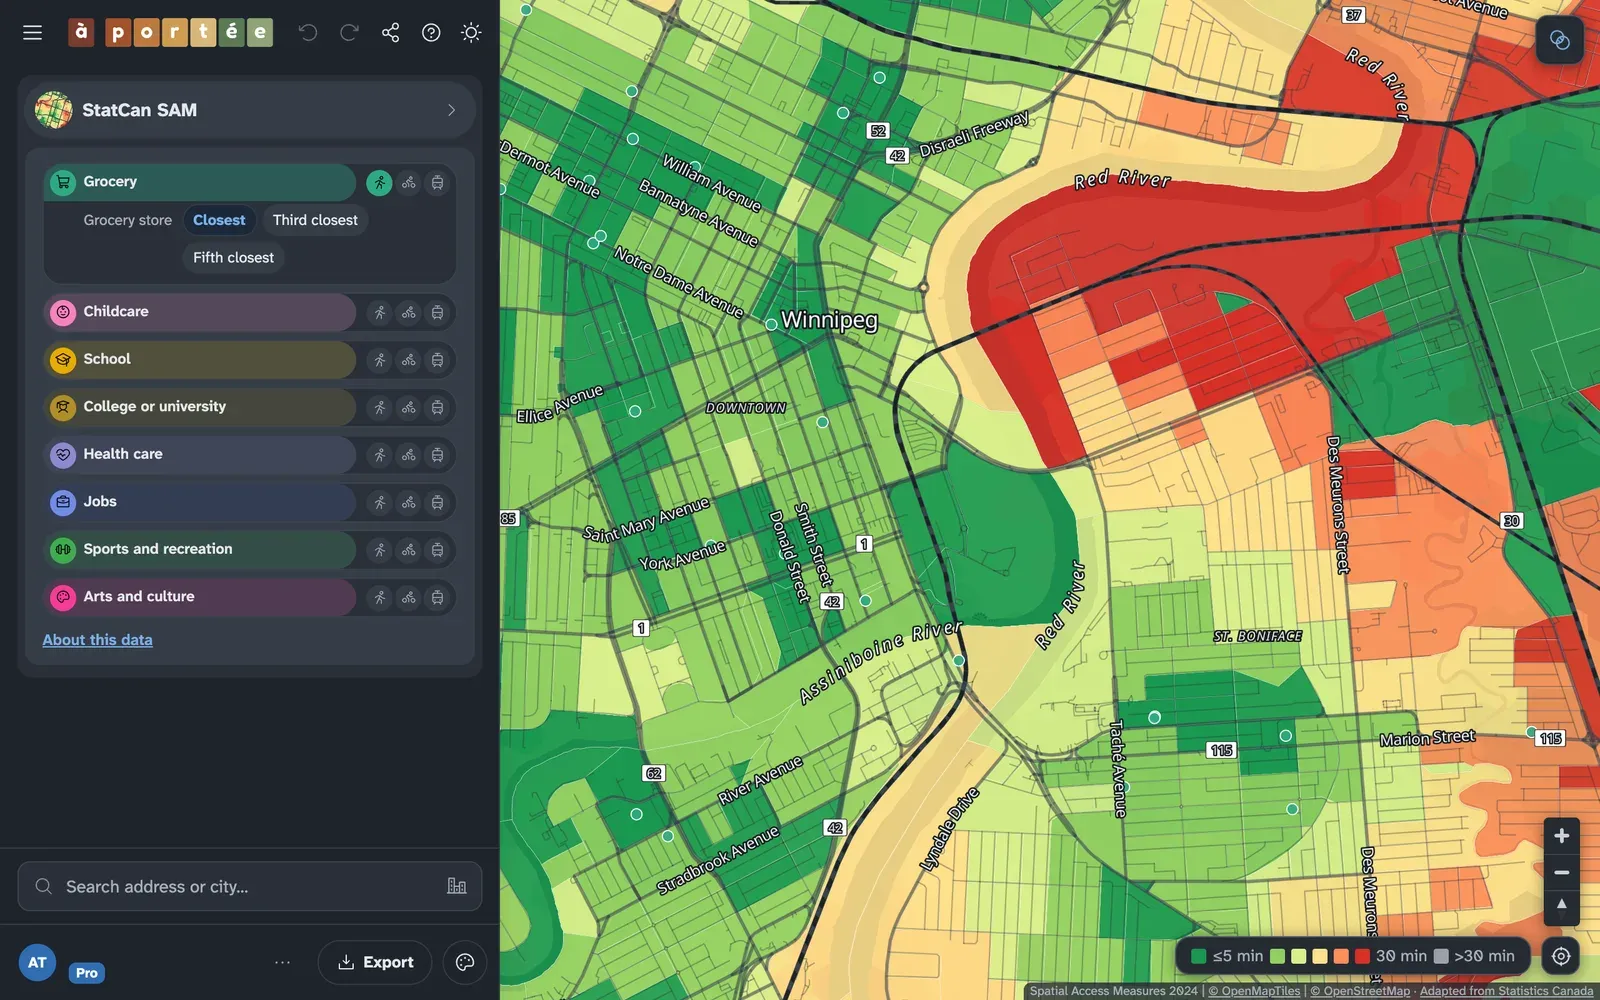
Section titled “StatCan SAM”Statistics Canada’s Spatial Access Measures, from 2024 data, rate how well each census block reaches eight kinds of destination by walking, cycling and transit (Statistics Canada, 2025). Choose a destination, then a mode; a mode SAM doesn’t measure for that destination is greyed out. Each destination offers SAM’s own options:
- Cycling: routes for cautious cyclists, confident cyclists, or any rider.
- Transit: peak or off-peak.
- Groceries: the closest, third-closest or fifth-closest store.
Grocery stores are travel times on the same colours as Minutes, so you can compare the two views directly, though SAM’s list of grocery stores differs from à portée’s. The other destinations are access scores from 0 to 1, with their own legend. See Spatial Access Measures for the data.
Landscape and Skyline
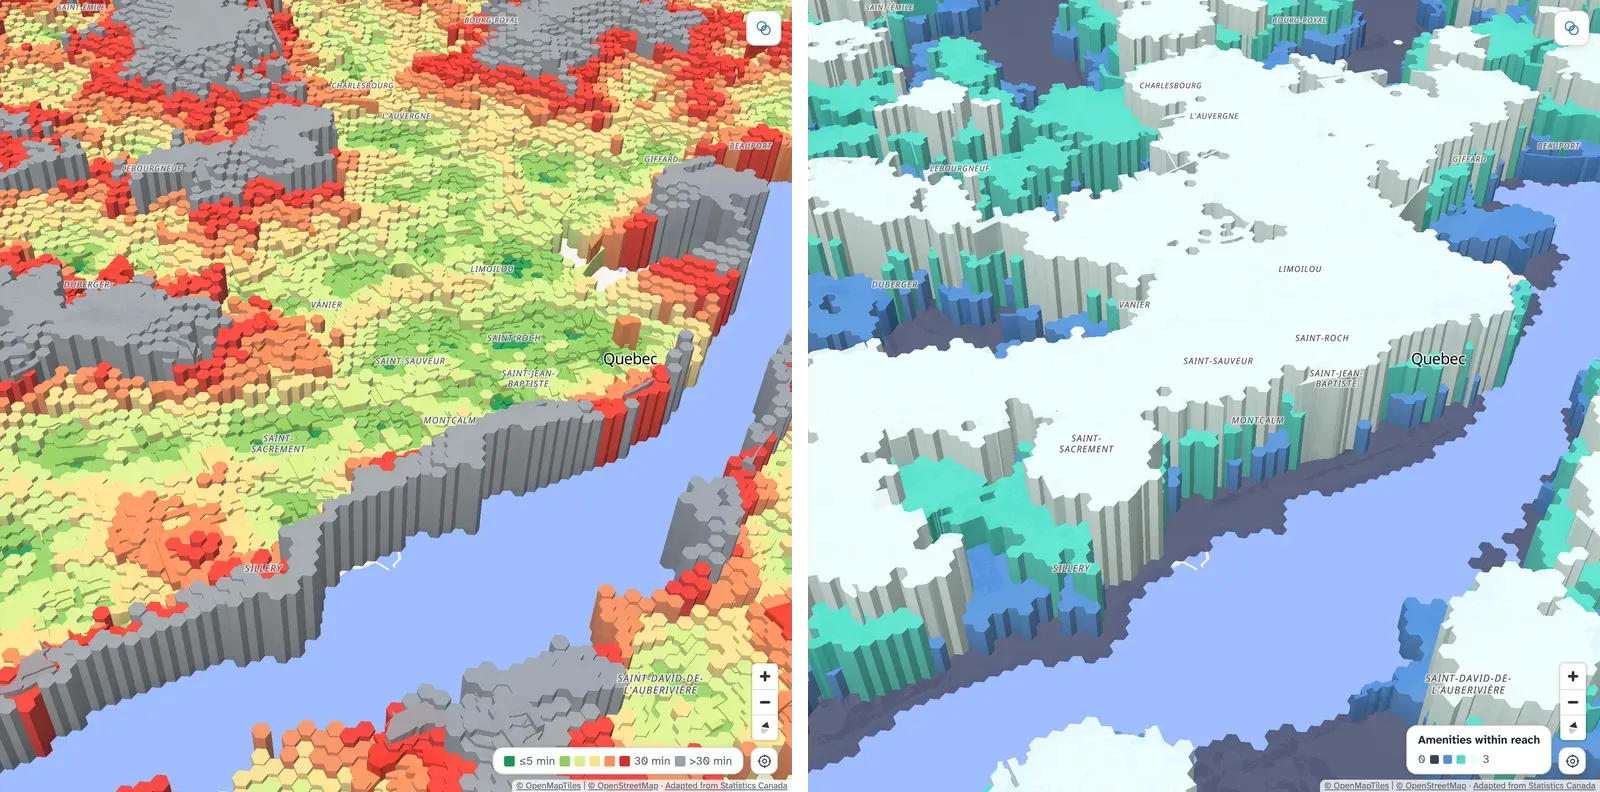
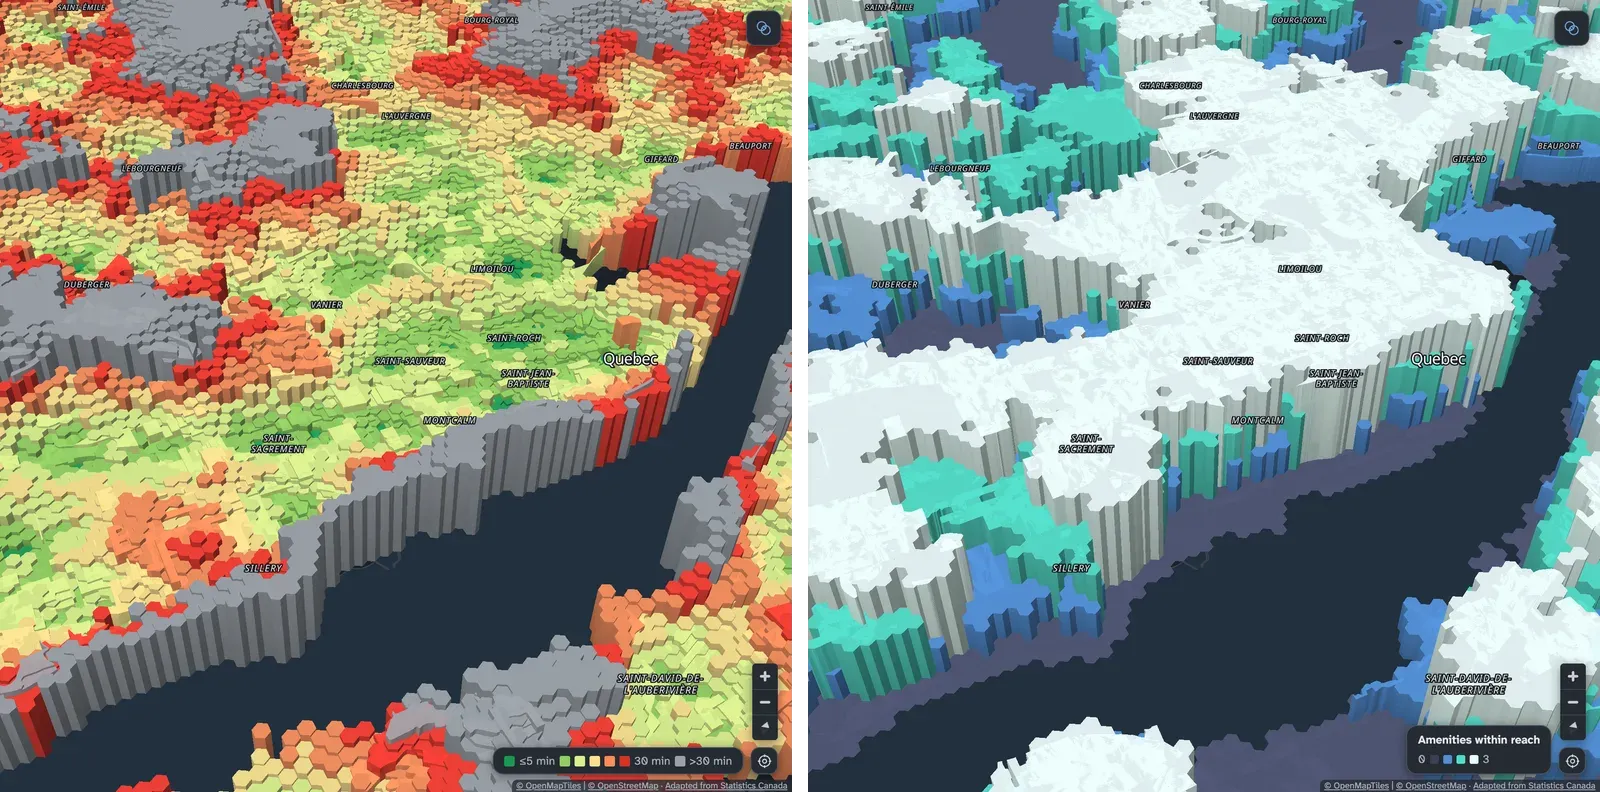
Section titled “Landscape and Skyline”Landscape and Skyline draw the map in 3D.
- Landscape raises each block by its minutes to the selected kinds of place, so poorly served areas become ridges. Its colour shows either the minutes or which selected place is the farthest; in the second, blocks are grey where every selected place is within 15 minutes.
- Skyline raises each block by how many of the selected kinds of place are within reach (each within its row’s limit, or 15 minutes without one), so well-served centres become towers.
Ready-made sets of amenities, and your own saved sets, are on Presets and starter packs.