
Changelog
What’s new on the site and the map in each release, newest first. The notes on each update to the data are on the methodology page.
1.1, 25 October 2026
Section titled “1.1, 25 October 2026”Walking, cycling and transit figures for 1,000 communities
Section titled “Walking, cycling and transit figures for 1,000 communities”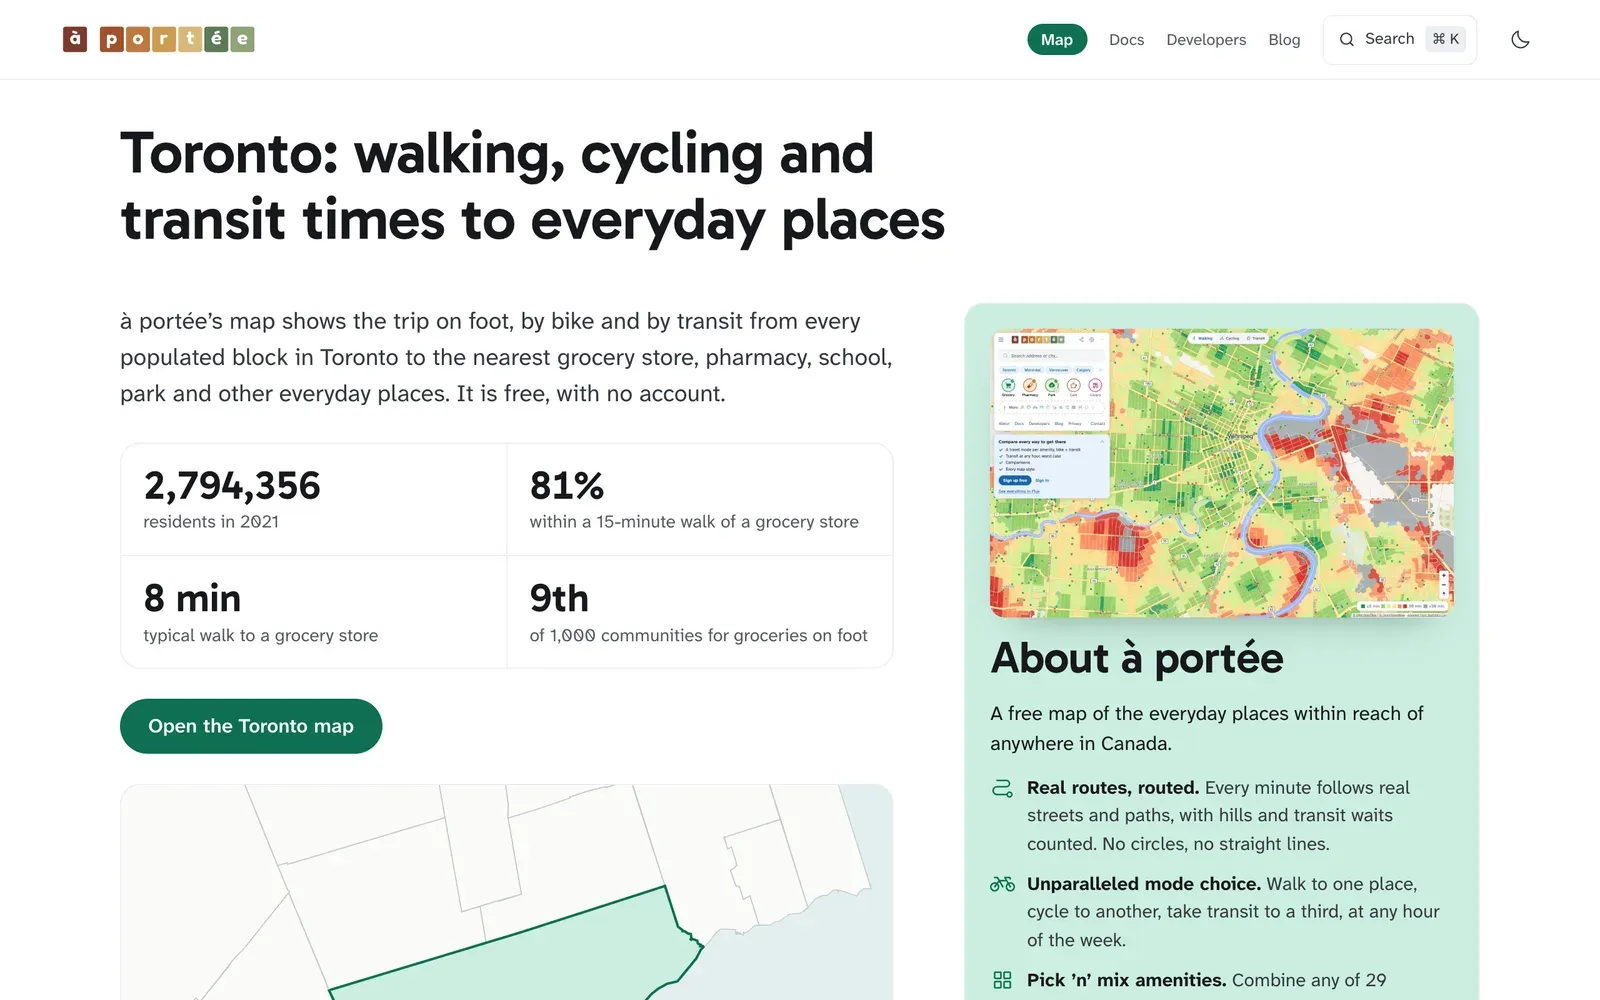
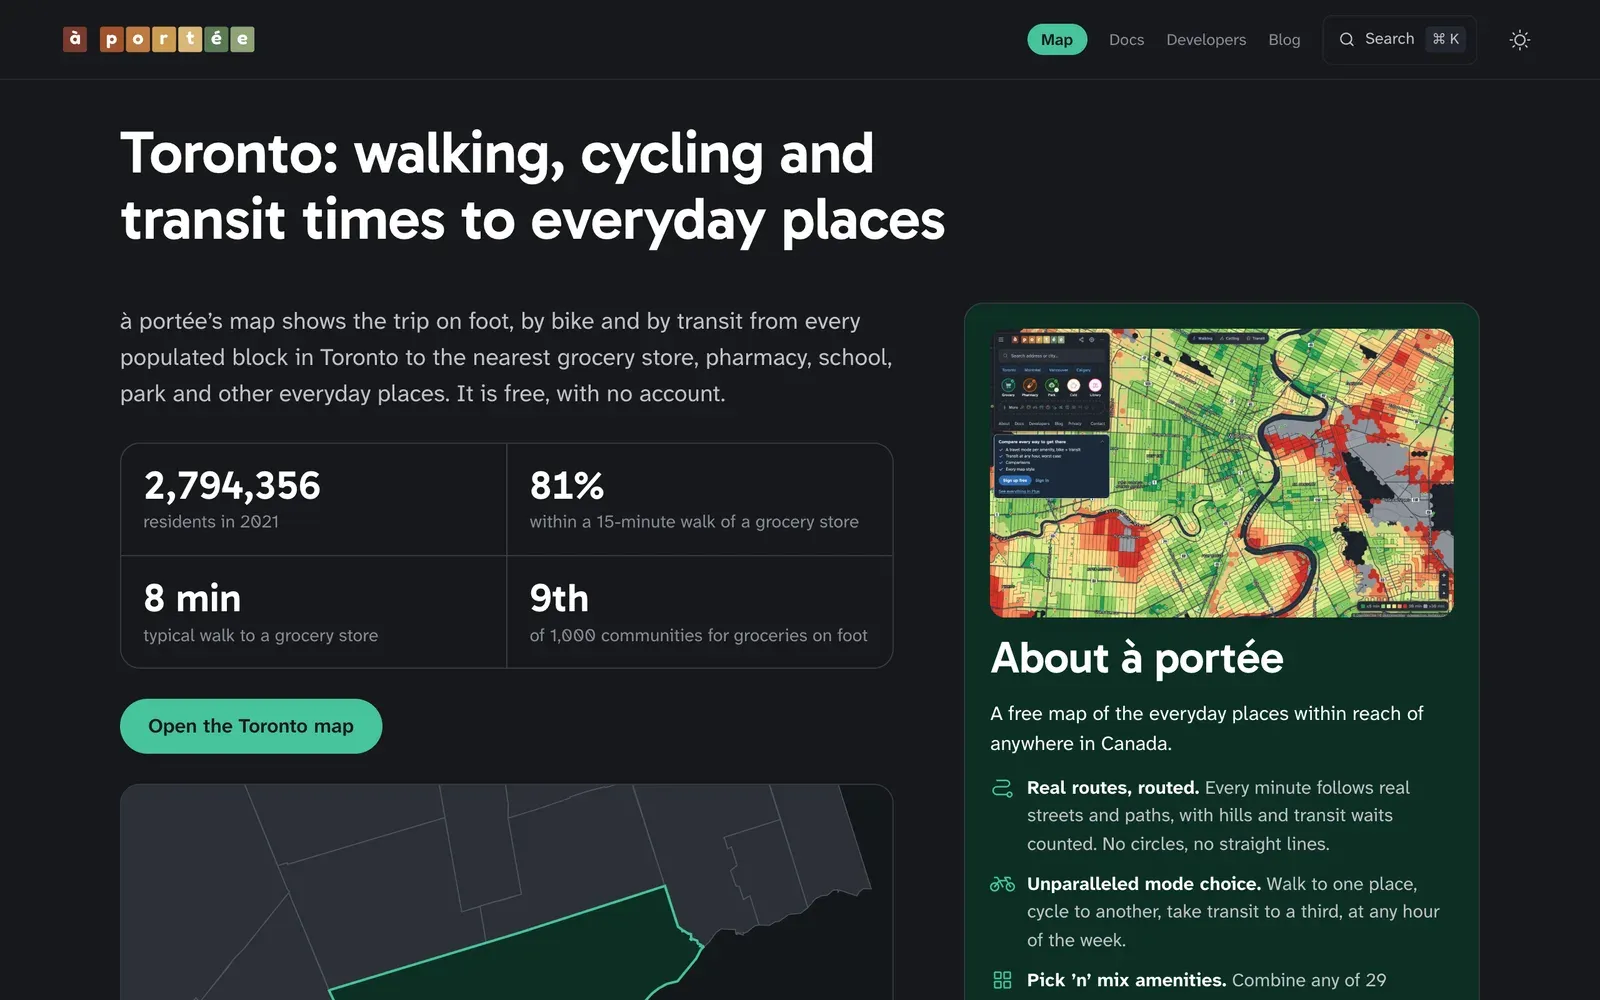
In 1.1, each of 1,000 Canadian communities has a page with its own figures for walking, cycling and transit, and a live map of the community you can open in à portée.
City pages
- On foot, by bike and by transit. For each community, the share of residents within 10, 15, 20 and 30 minutes of a grocery store, a pharmacy, a park and an elementary school, and the typical trip. Where the community has transit timetables, transit is for the weekday morning peak.
- How it compares. Each community’s rank among the 1,000 and within its province, beside the provincial and national figures and communities of a similar size.
- Questions and answers, such as “Is Halifax walkable?”, answered from the community’s own figures.
- Counted where people live. We count the residents of each census block larger than 0.1 km² in the map’s hexagons where its homes are.
- Locator maps show the community among its neighbours and in Canada.
- A live map of the community opens in à portée with one click, light or dark to match the page.
- Links to the community on Wikipedia, Wikivoyage, OpenStreetMap, its official site and Statistics Canada’s census profile.
à portée pro
- Subscribe with your email. On the pro page, enter your email: the link we send signs you in and brings you back to pay, CAD $20 a month.
à portée plus
- Hexagons, census blocks or both. In Map style, choose to draw the map as hexagons about 130 metres across, as census blocks, or as small blocks with hexagons inside the large ones.
- Smooth colours. Colour the hexagons minute by minute, from 0 to 30 minutes, with a switch under More settings.
- The dark map, with dark panels to match, for evenings.
- Export the map as an image, from the Export pane.
- Compare a saved place with the map you’re looking at, from the place’s menu.
Docs
- How accurate the figures are. On Accuracy and corrections, read what the times leave out and the errors the data can contain, see the corrections we’ve made, and report a problem. You can reach it from a short note beside the figures on the city pages and in the map’s About panel.
- Walking speed. A 2 km walk along the streets takes about 33 minutes at 3.6 km/h, the pace the map assumes. More in the methodology.
Interface improvements
- We’ve improved the saved places pane: each place shows the kinds of place it keeps as coloured dots.
- The Save button in the saved places pane saves the map as it is, in one click.
- A thin bar along the top of the map shows that a new travel mode or view is still loading.
- Interface tweaks to the free map for a smoother experience on phones and desktop.
- The map centres your place in the part of the screen you can see, beside the sidebar.
- In the side-by-side comparison, each map has its own legend and shows your pin at the same moment, to make comparisons easier.
- Layout fixes for tablets: the legend and side panes fit on screen, and the travel-mode switch stays put while the page loads.
- In each place’s row, the minutes sit beside the time slider and leave the whole slider in view.
- Accessibility improvements on the home page.
- The map tile on the home page sits in an even white frame.
1.0, 24 October 2026
Section titled “1.0, 24 October 2026”Everyday places across Canada, on foot, by bike and by transit
Section titled “Everyday places across Canada, on foot, by bike and by transit”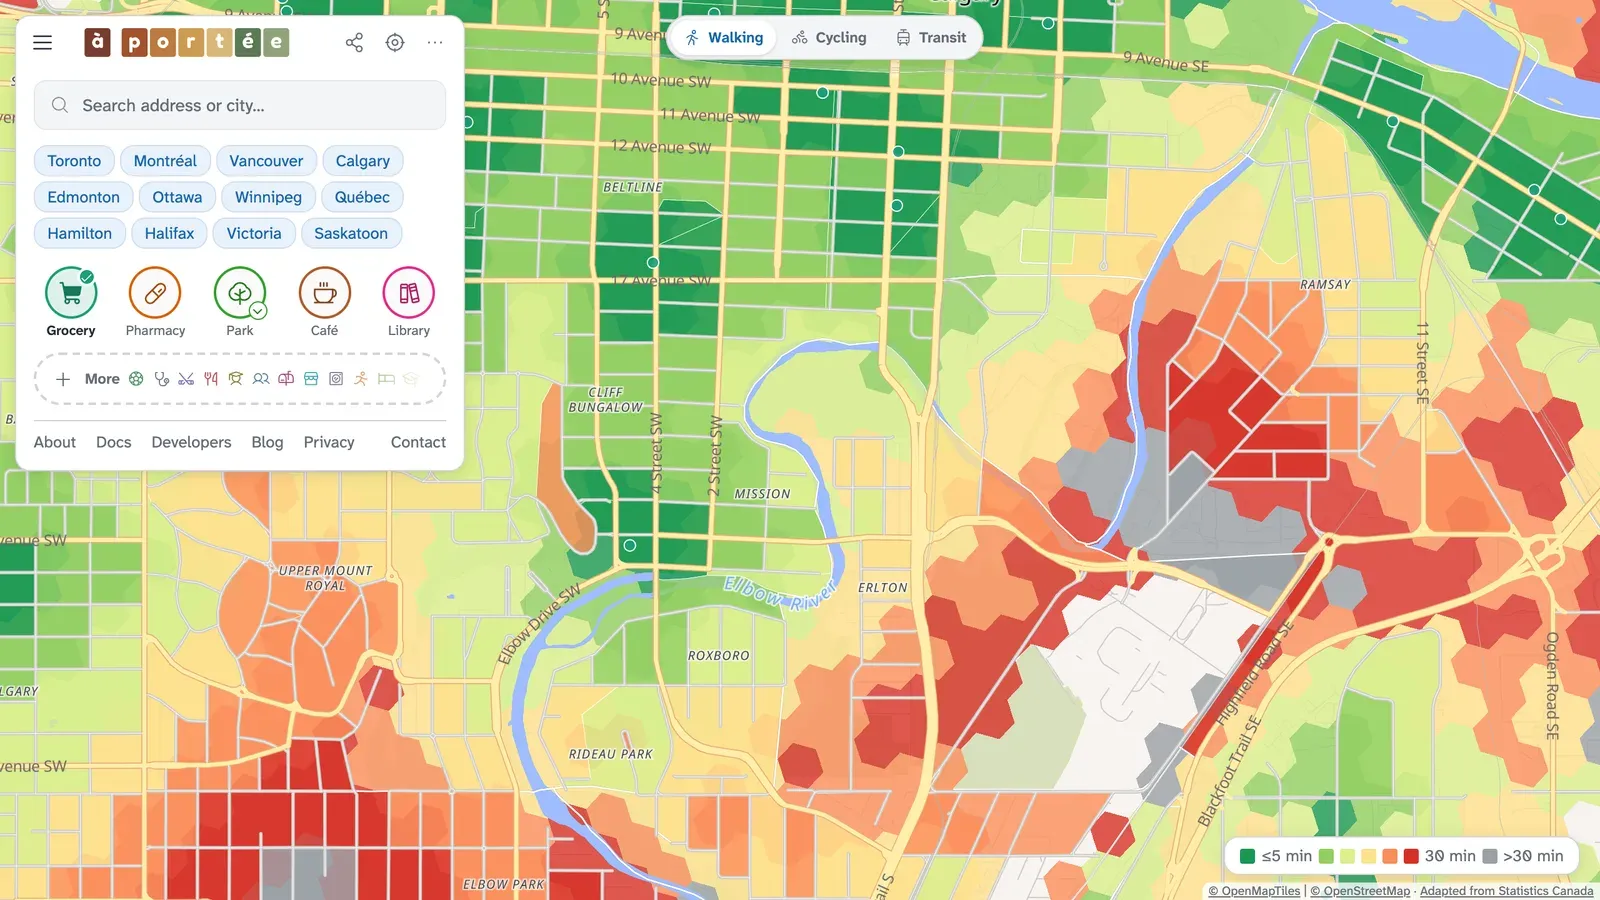
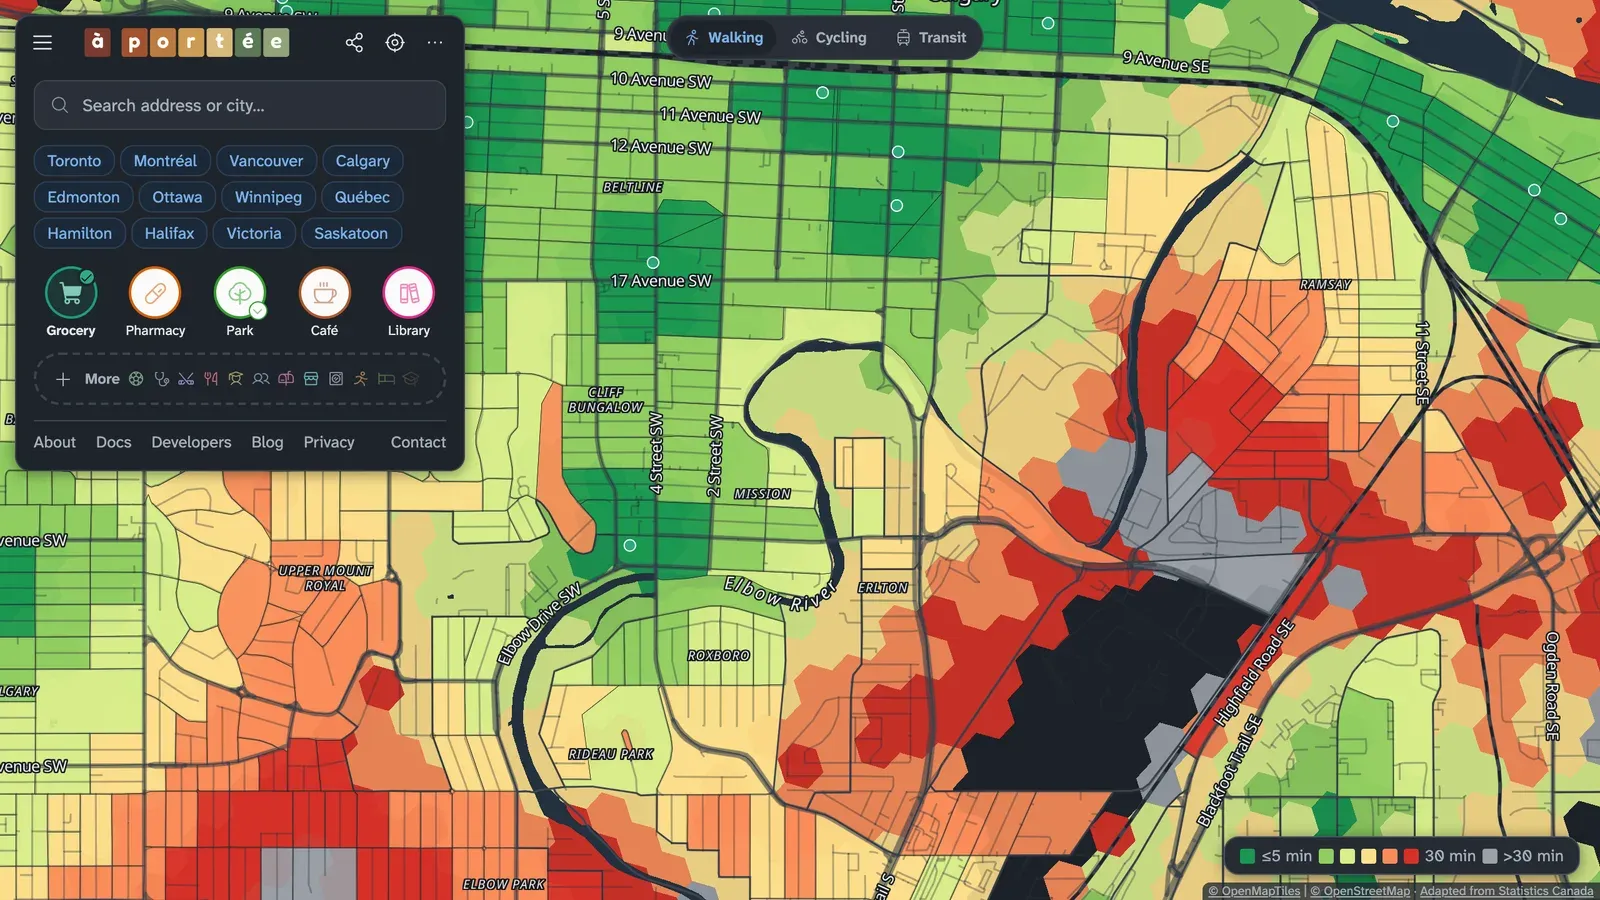
aportee.ca is open to everyone. Pick the places that matter to you, and the map colours the inhabited census blocks of Canada by how long it takes to reach them along real streets and paths. Walking, cycling and transit are all on the free map, with no account.
The map
- Walking, cycling and transit. Choose one travel mode for the whole map. Transit times are for the weekday morning peak, from 128 timetables published by 85 operators.
- 29 kinds of place, plus park sizes and school levels. The newest are post-secondary schools, convenience stores, post offices, banks, dentists, laundromats, dog parks, places of worship, pools, ice rinks and sports fields. See Amenities.
- Detail in the countryside. The map shows travel times hexagon by hexagon, about 130 metres across.
- Streets. Colour each street by its walking time.
- Search finds places on the map as well as towns and addresses, starting near where you are looking, and remembers your recent searches.
- Light and dark themes, following your device.
à portée plus, free with an email address
- A travel mode and a time limit for each place, bike + transit included: walk to the grocery store and cycle to the library on the same map.
- Transit at other times: weekday night, and Saturday and Sunday midday, with a typical or a worst-case wait.
- Compare two travel modes, two sets of places, two map views or two places, swiped, side by side or as a difference.
- Two more map views: how well a neighbourhood supports walking (Can-ALE), and Statistics Canada’s measures of access (StatCan SAM).
- Pin any spot for a card of its trips to everything you picked.
- Starter packs open the map on a set of places for a way of living, such as a young family.
- Presets keep your own mix of places, modes and limits.
- Saved views keep a whole map, to come back to or share as a link.
- Map styles: four colour scales, four base maps, satellite imagery and 3D terrain.
à portée pro, CAD $20 a month
- No car, Ratio, Landscape and Skyline: four more map views.
- City sheets: a print-ready picture of a municipality, with one panel per kind of place.
- Subscribe on the pro page and cancel any time.
Data you can use
- Data published 8 October 2026: OpenStreetMap street extracts of 25 August 2026, Overture Maps places of 23 September 2026 and Statistics Canada’s health and education databases.
- Open data. Download the 626,638 places the map measures to, free under the Open Database License. See Open data.
- City pages. Each city has a page with its share of residents within a 15-minute walk of a grocery store, pharmacy, park and elementary school, set against its province.
Around the site
- A home page. Visit aportee.ca to see what the map measures, who uses it and what each plan includes.
- A guide to reading the map and to how the times are computed, in English and French, with pictures of every map view.
- Phones and tablets: larger controls to tap, a sheet you pull up from the foot of the screen on phones, and the place card beside the sidebar on tablets.
- Places are counted the way you would expect: a bakery-café appears as a bakery and as a café, colleges and universities are a kind of place of their own, and a park listed twice shows once.
- The map opens straight on your city.
Previous updates
Section titled “Previous updates”- October 2026. 29 kinds of place, the plus and pro plans, Compare, the open data and, on 24 October, version 1.0.
- September 2026. More places on the map. The first cycling and transit times.
- August 2026. In rural areas, travel times hexagon by hexagon, about 130 metres across.
- July 2026. The walking map went up at aportee.ca, in English and French, with 18 kinds of place, address search, a dot for each place and a page for every municipality. Walking times began to count hills.
- June 2026. The first map: walking times from each census block in Hamilton to grocery stores and six other kinds of place, then across Canada.